# load packages
if(!require(pacman))
  install.packages("pacman")

pacman::p_load(tidyverse,
               scico)

# set theme for ggplot2
ggplot2::theme_set(ggplot2::theme_minimal(base_size = 14))

# set width of code output
options(width = 65)

# set figure parameters for knitr
knitr::opts_chunk$set(
  fig.width = 7, # 7" width
  fig.asp = 0.618, # the golden ratio
  fig.retina = 3, # dpi multiplier for displaying HTML output on retina
  fig.align = "center", # center align figures
  dpi = 300 # higher dpi, sharper image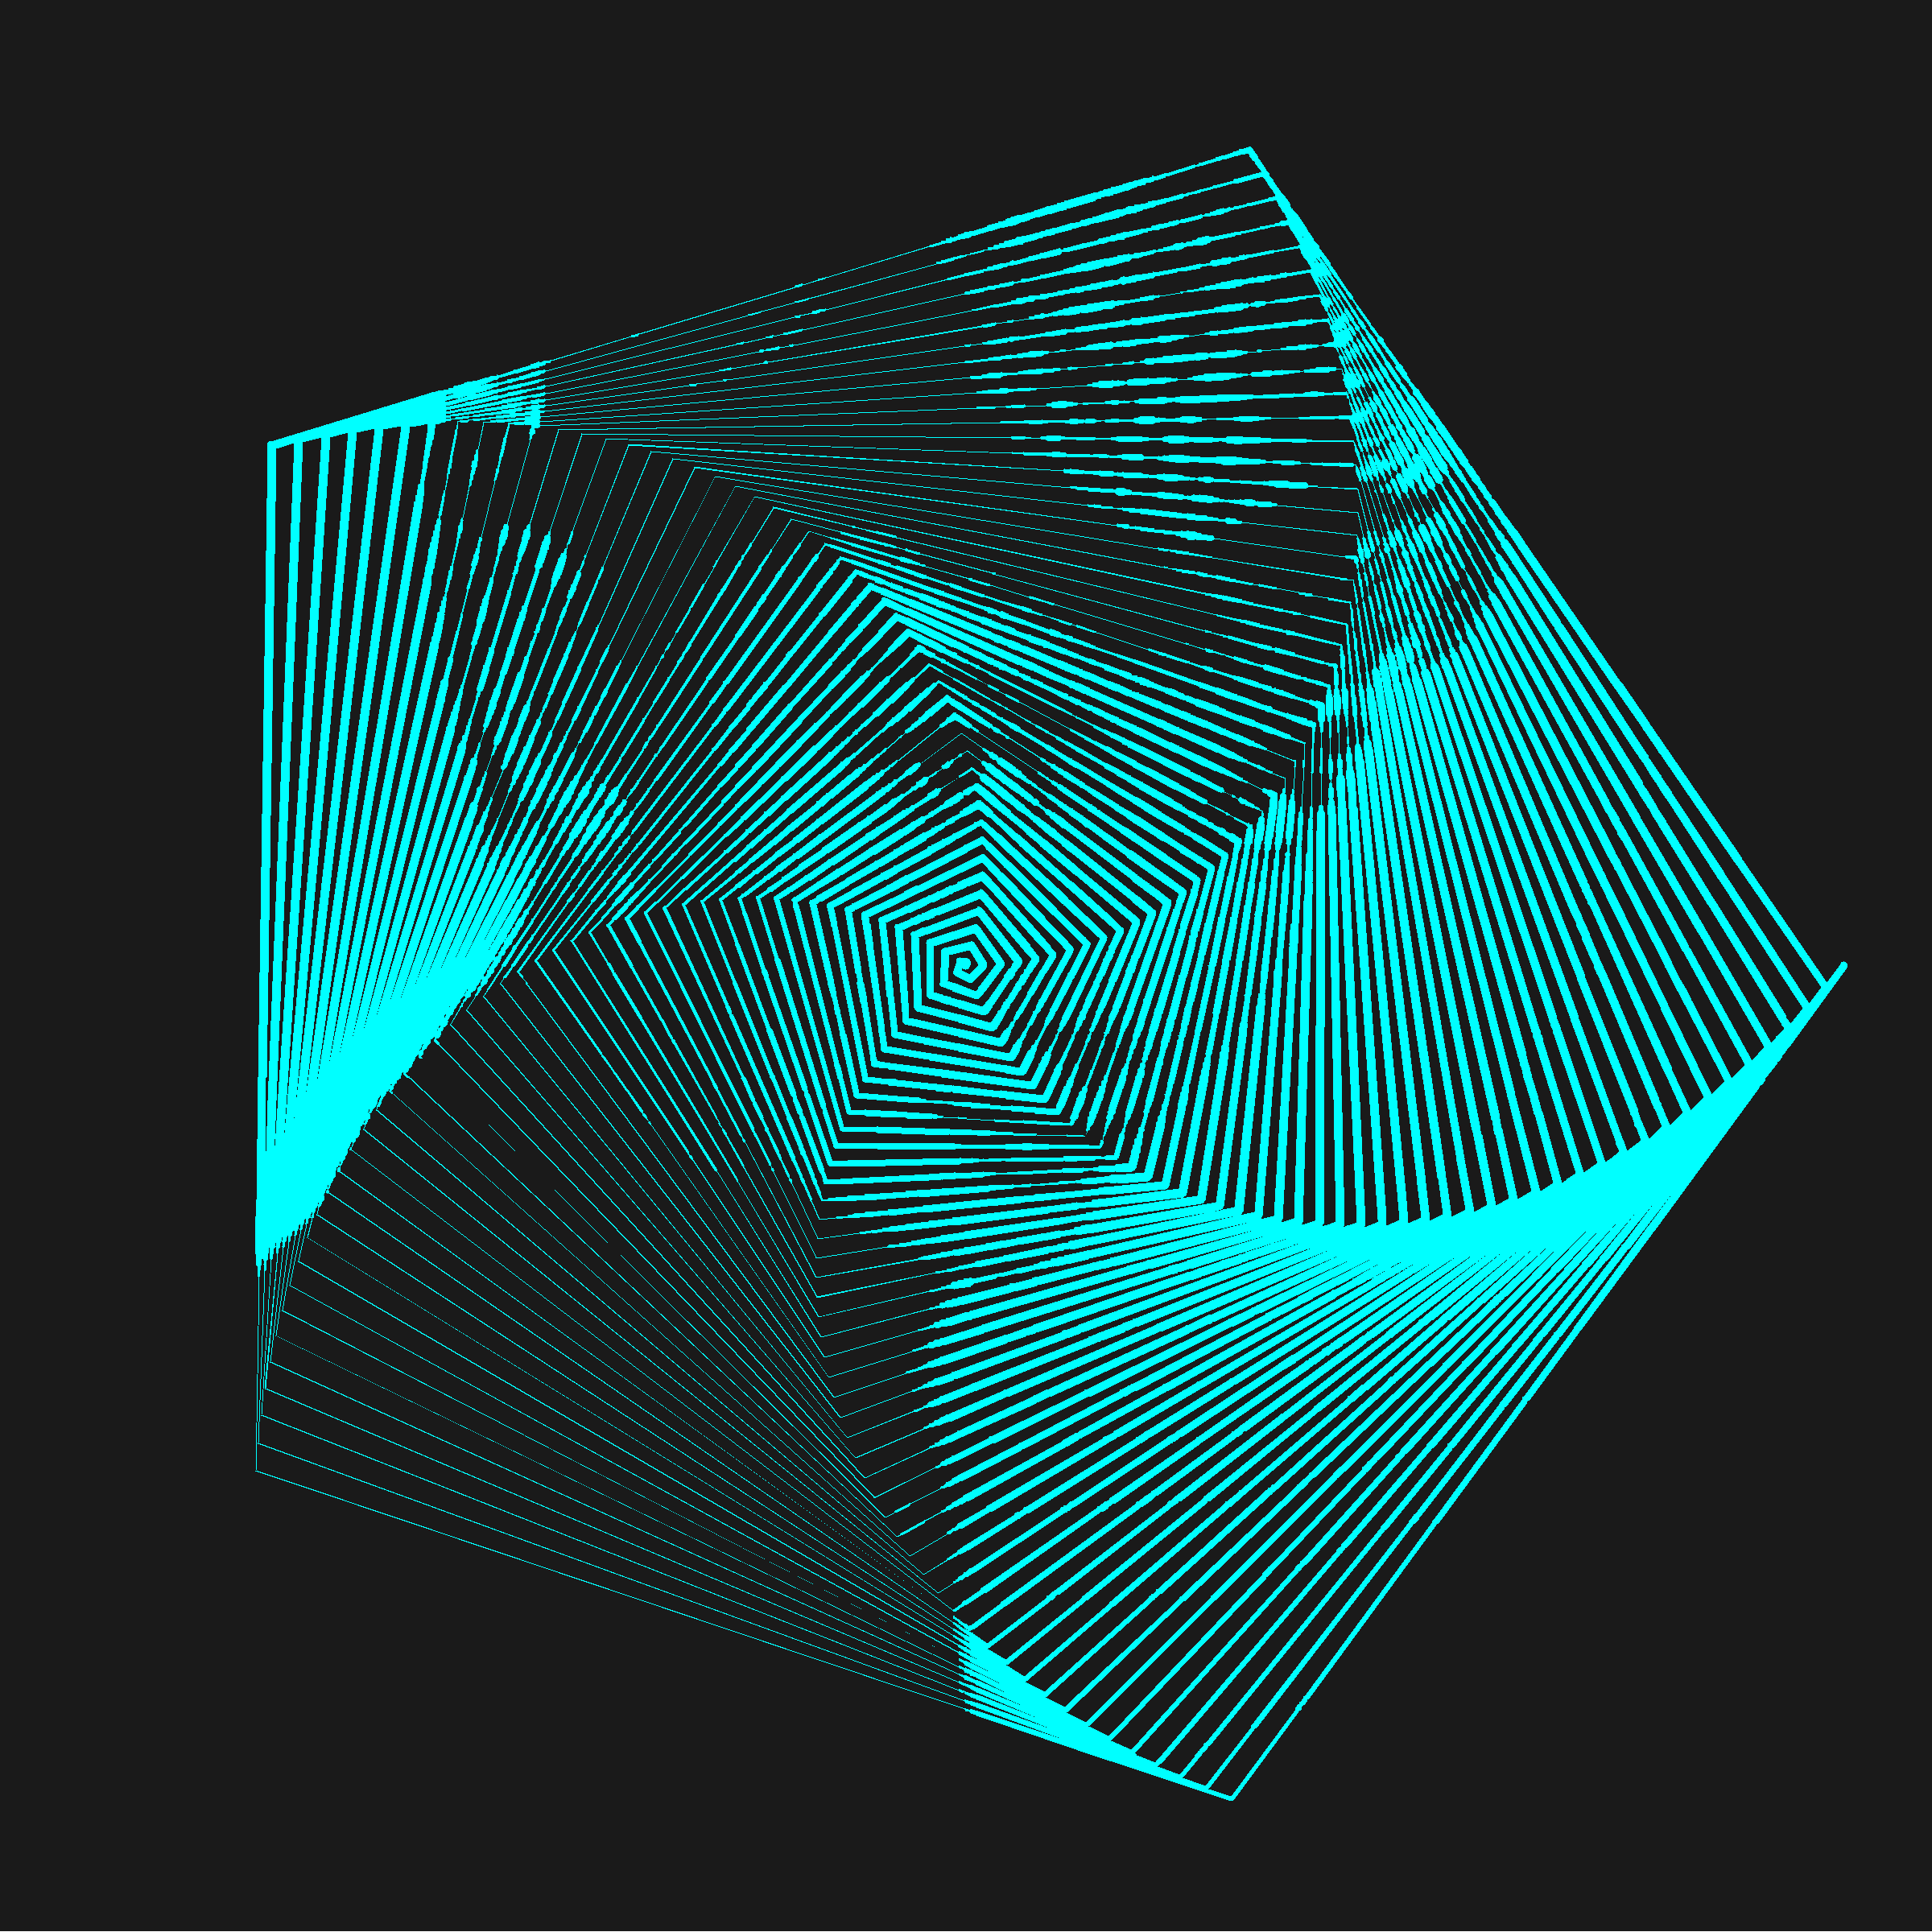
)Generative art
Lecture 23
Genesis 338
by Thomas Lin Pedersen

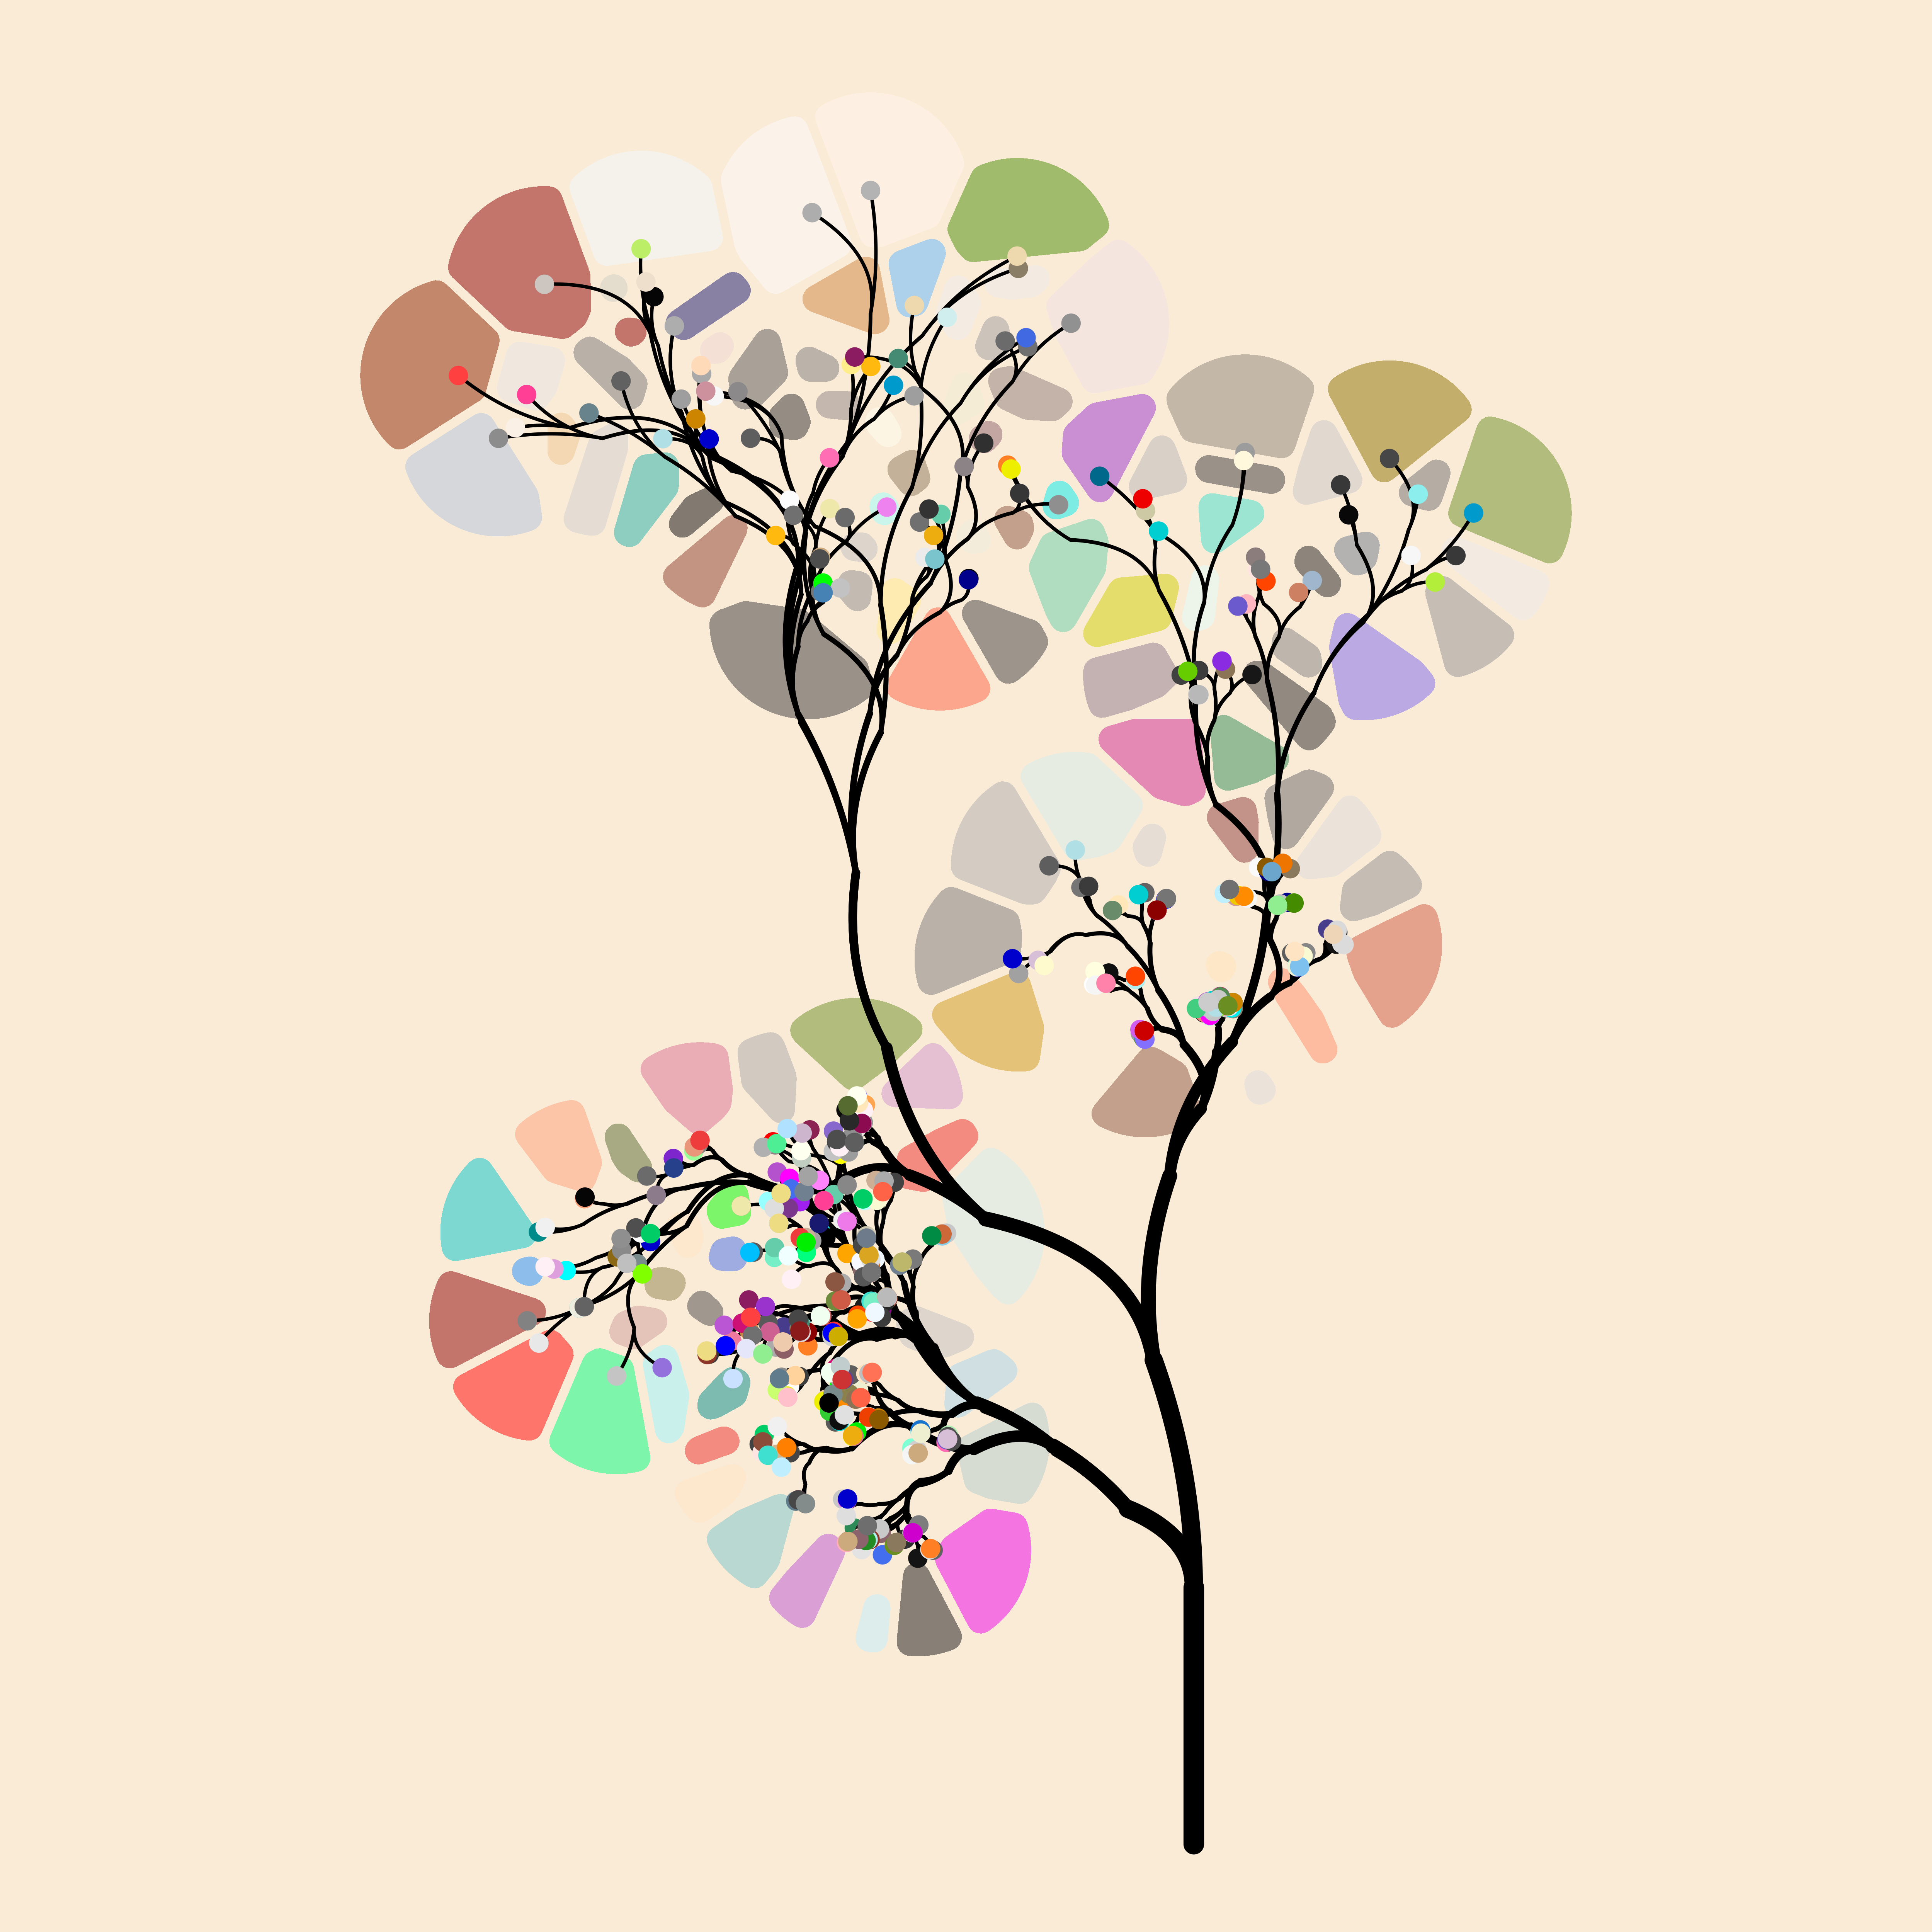
Flametree
by Danielle Navarro
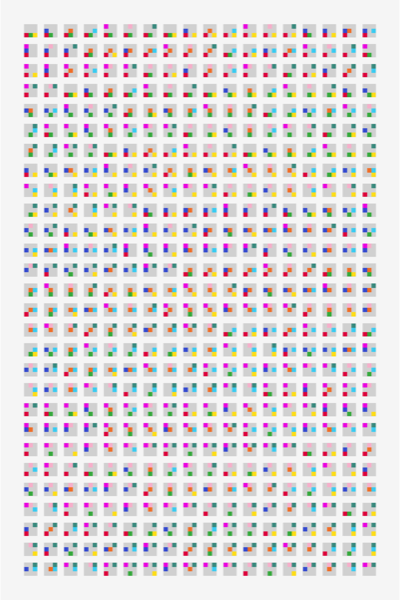
Permutations
by Georgios Karamanis
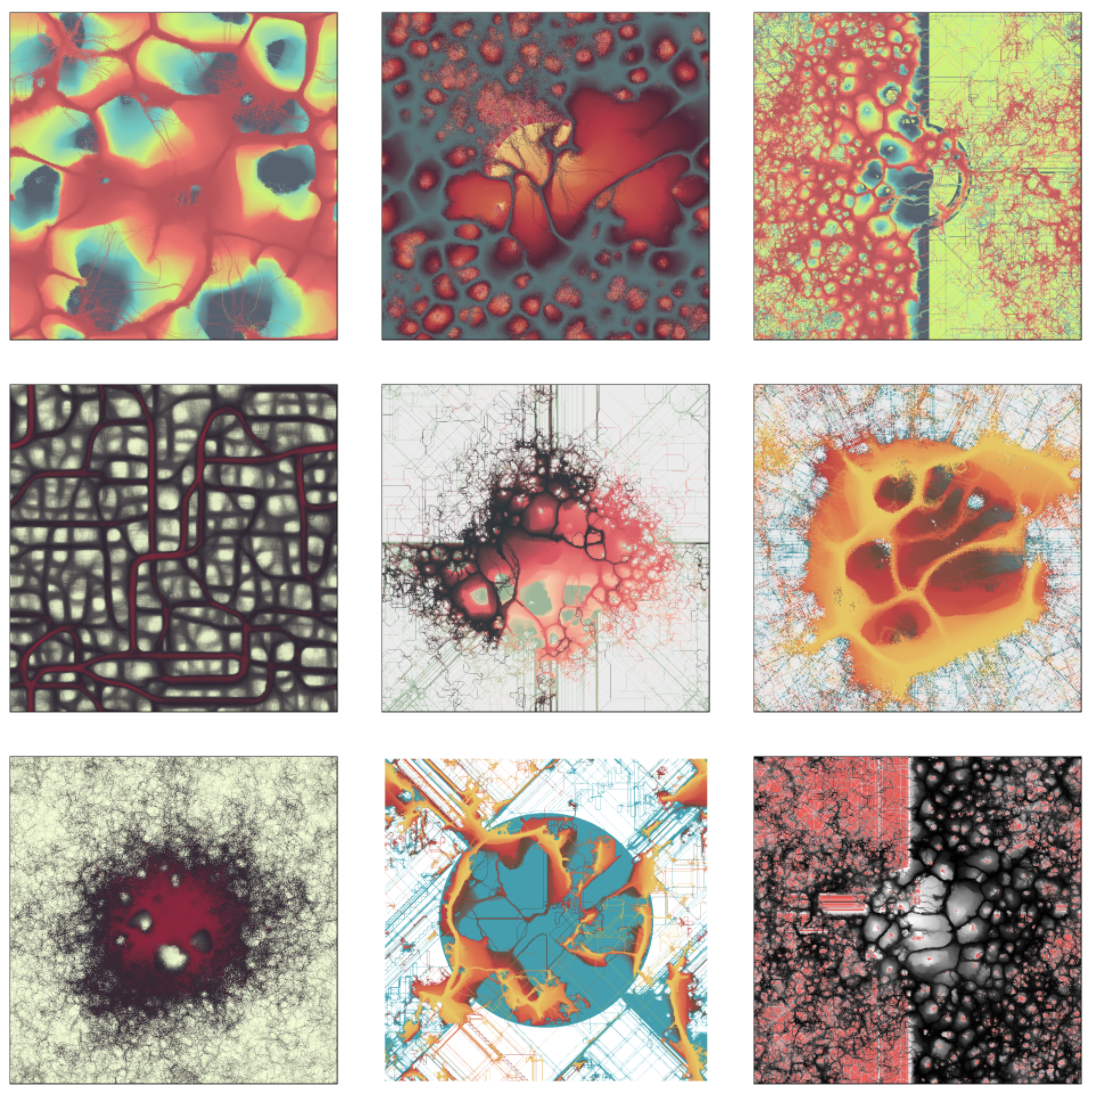
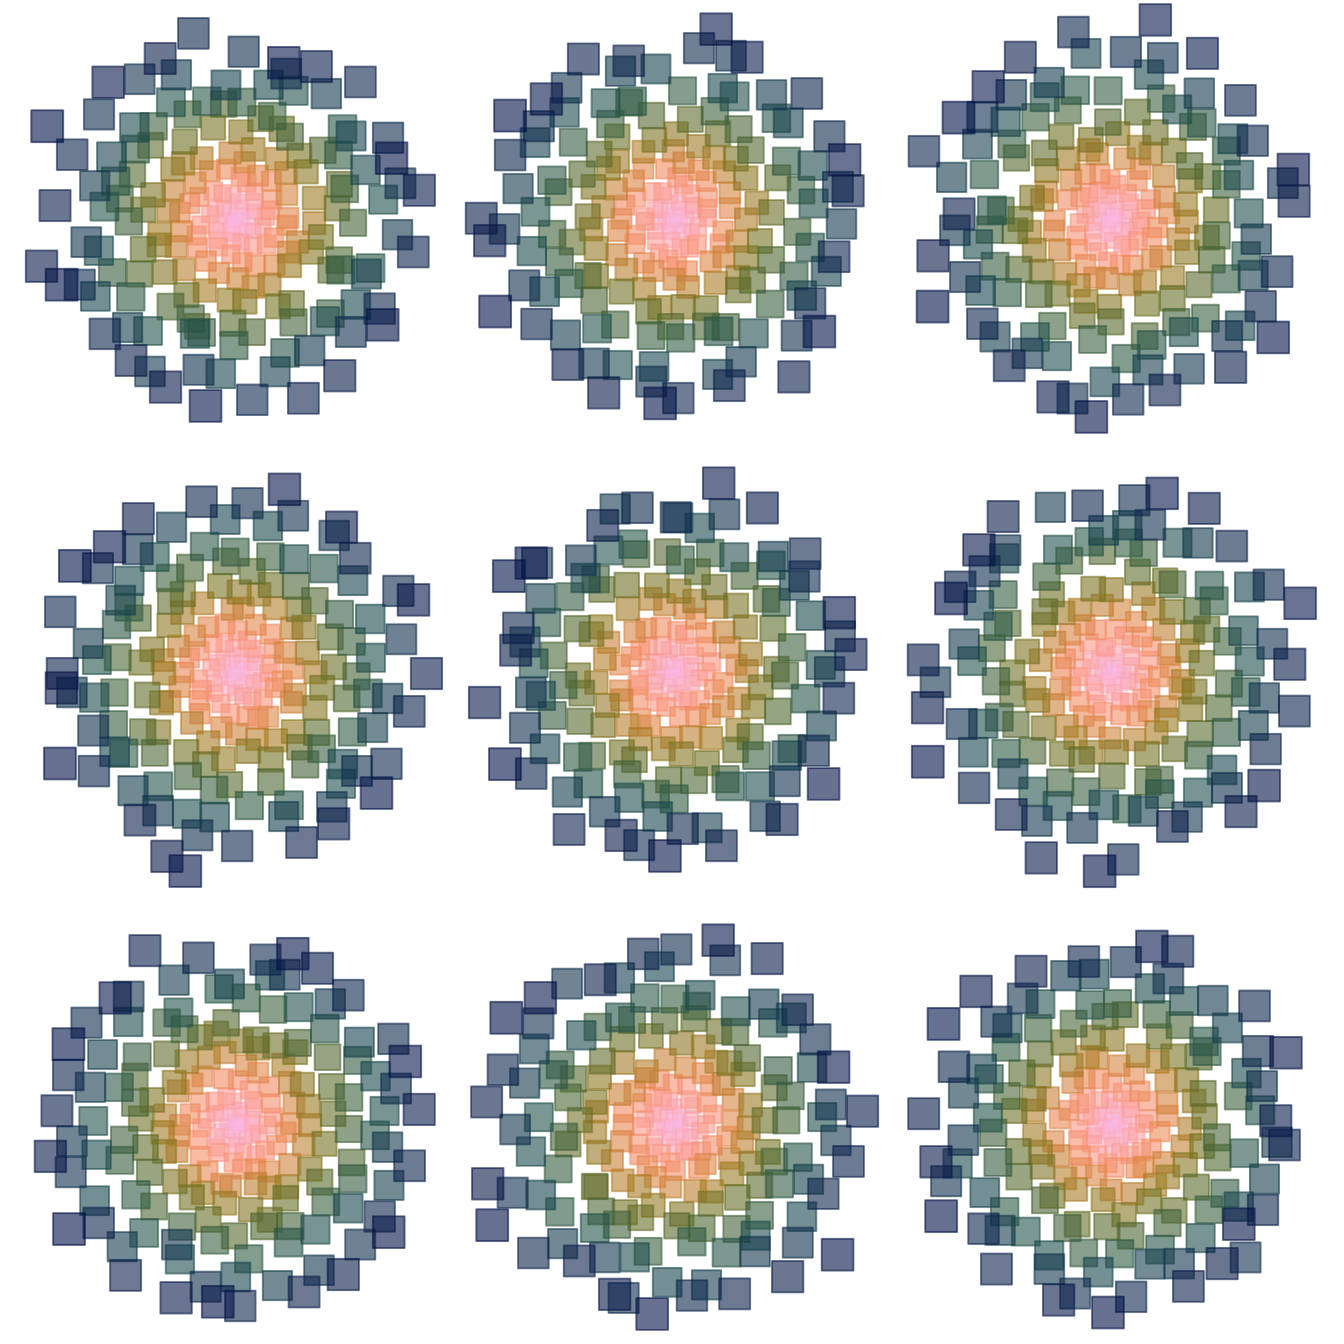
Abstractions
by Antonio Sánchez Chinchón
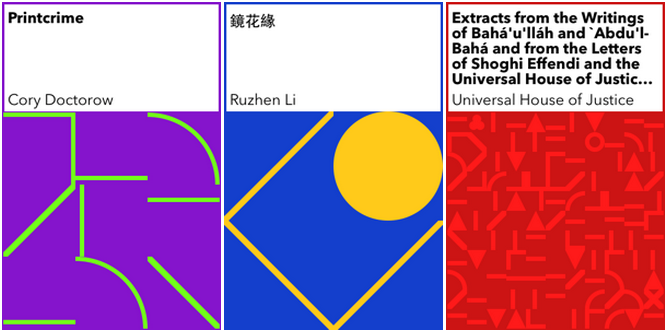
Generative art in use: Book covers
Just one of many examples of generative art as a practical solution by the New York Public Library:
To fill in missing book covers in an ebook-borrowing and reading app
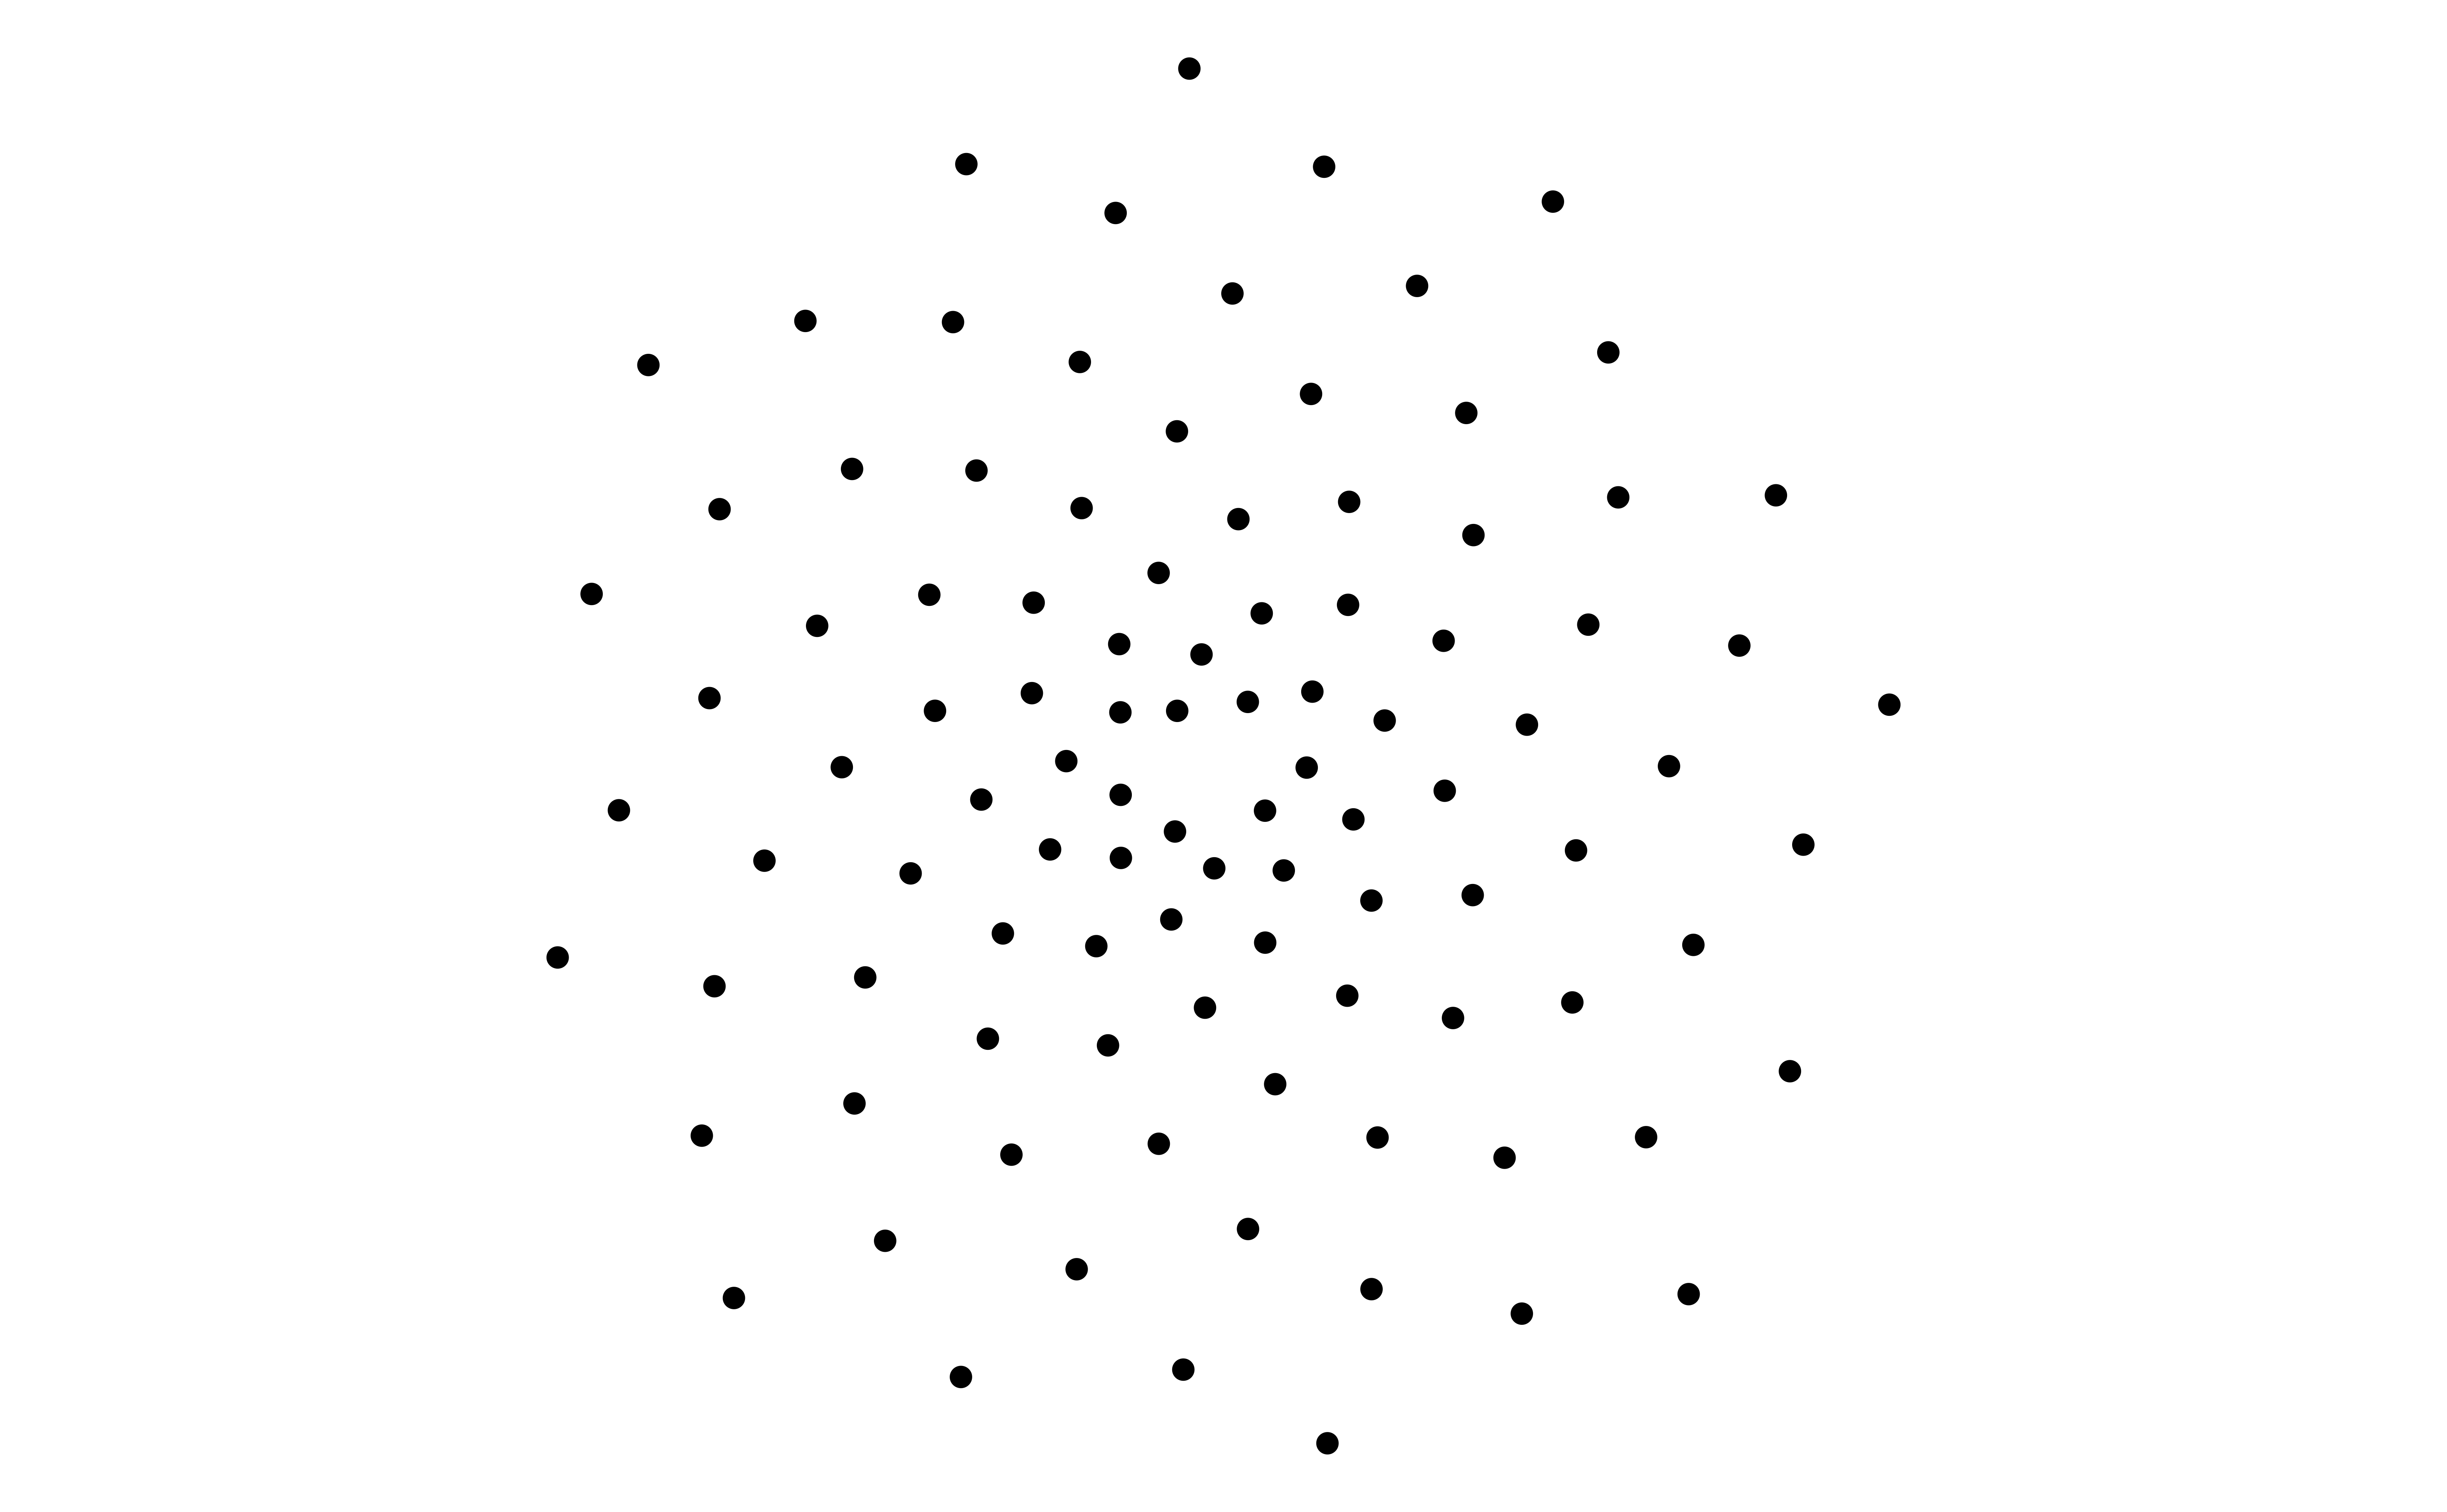
I can plot myself flowers
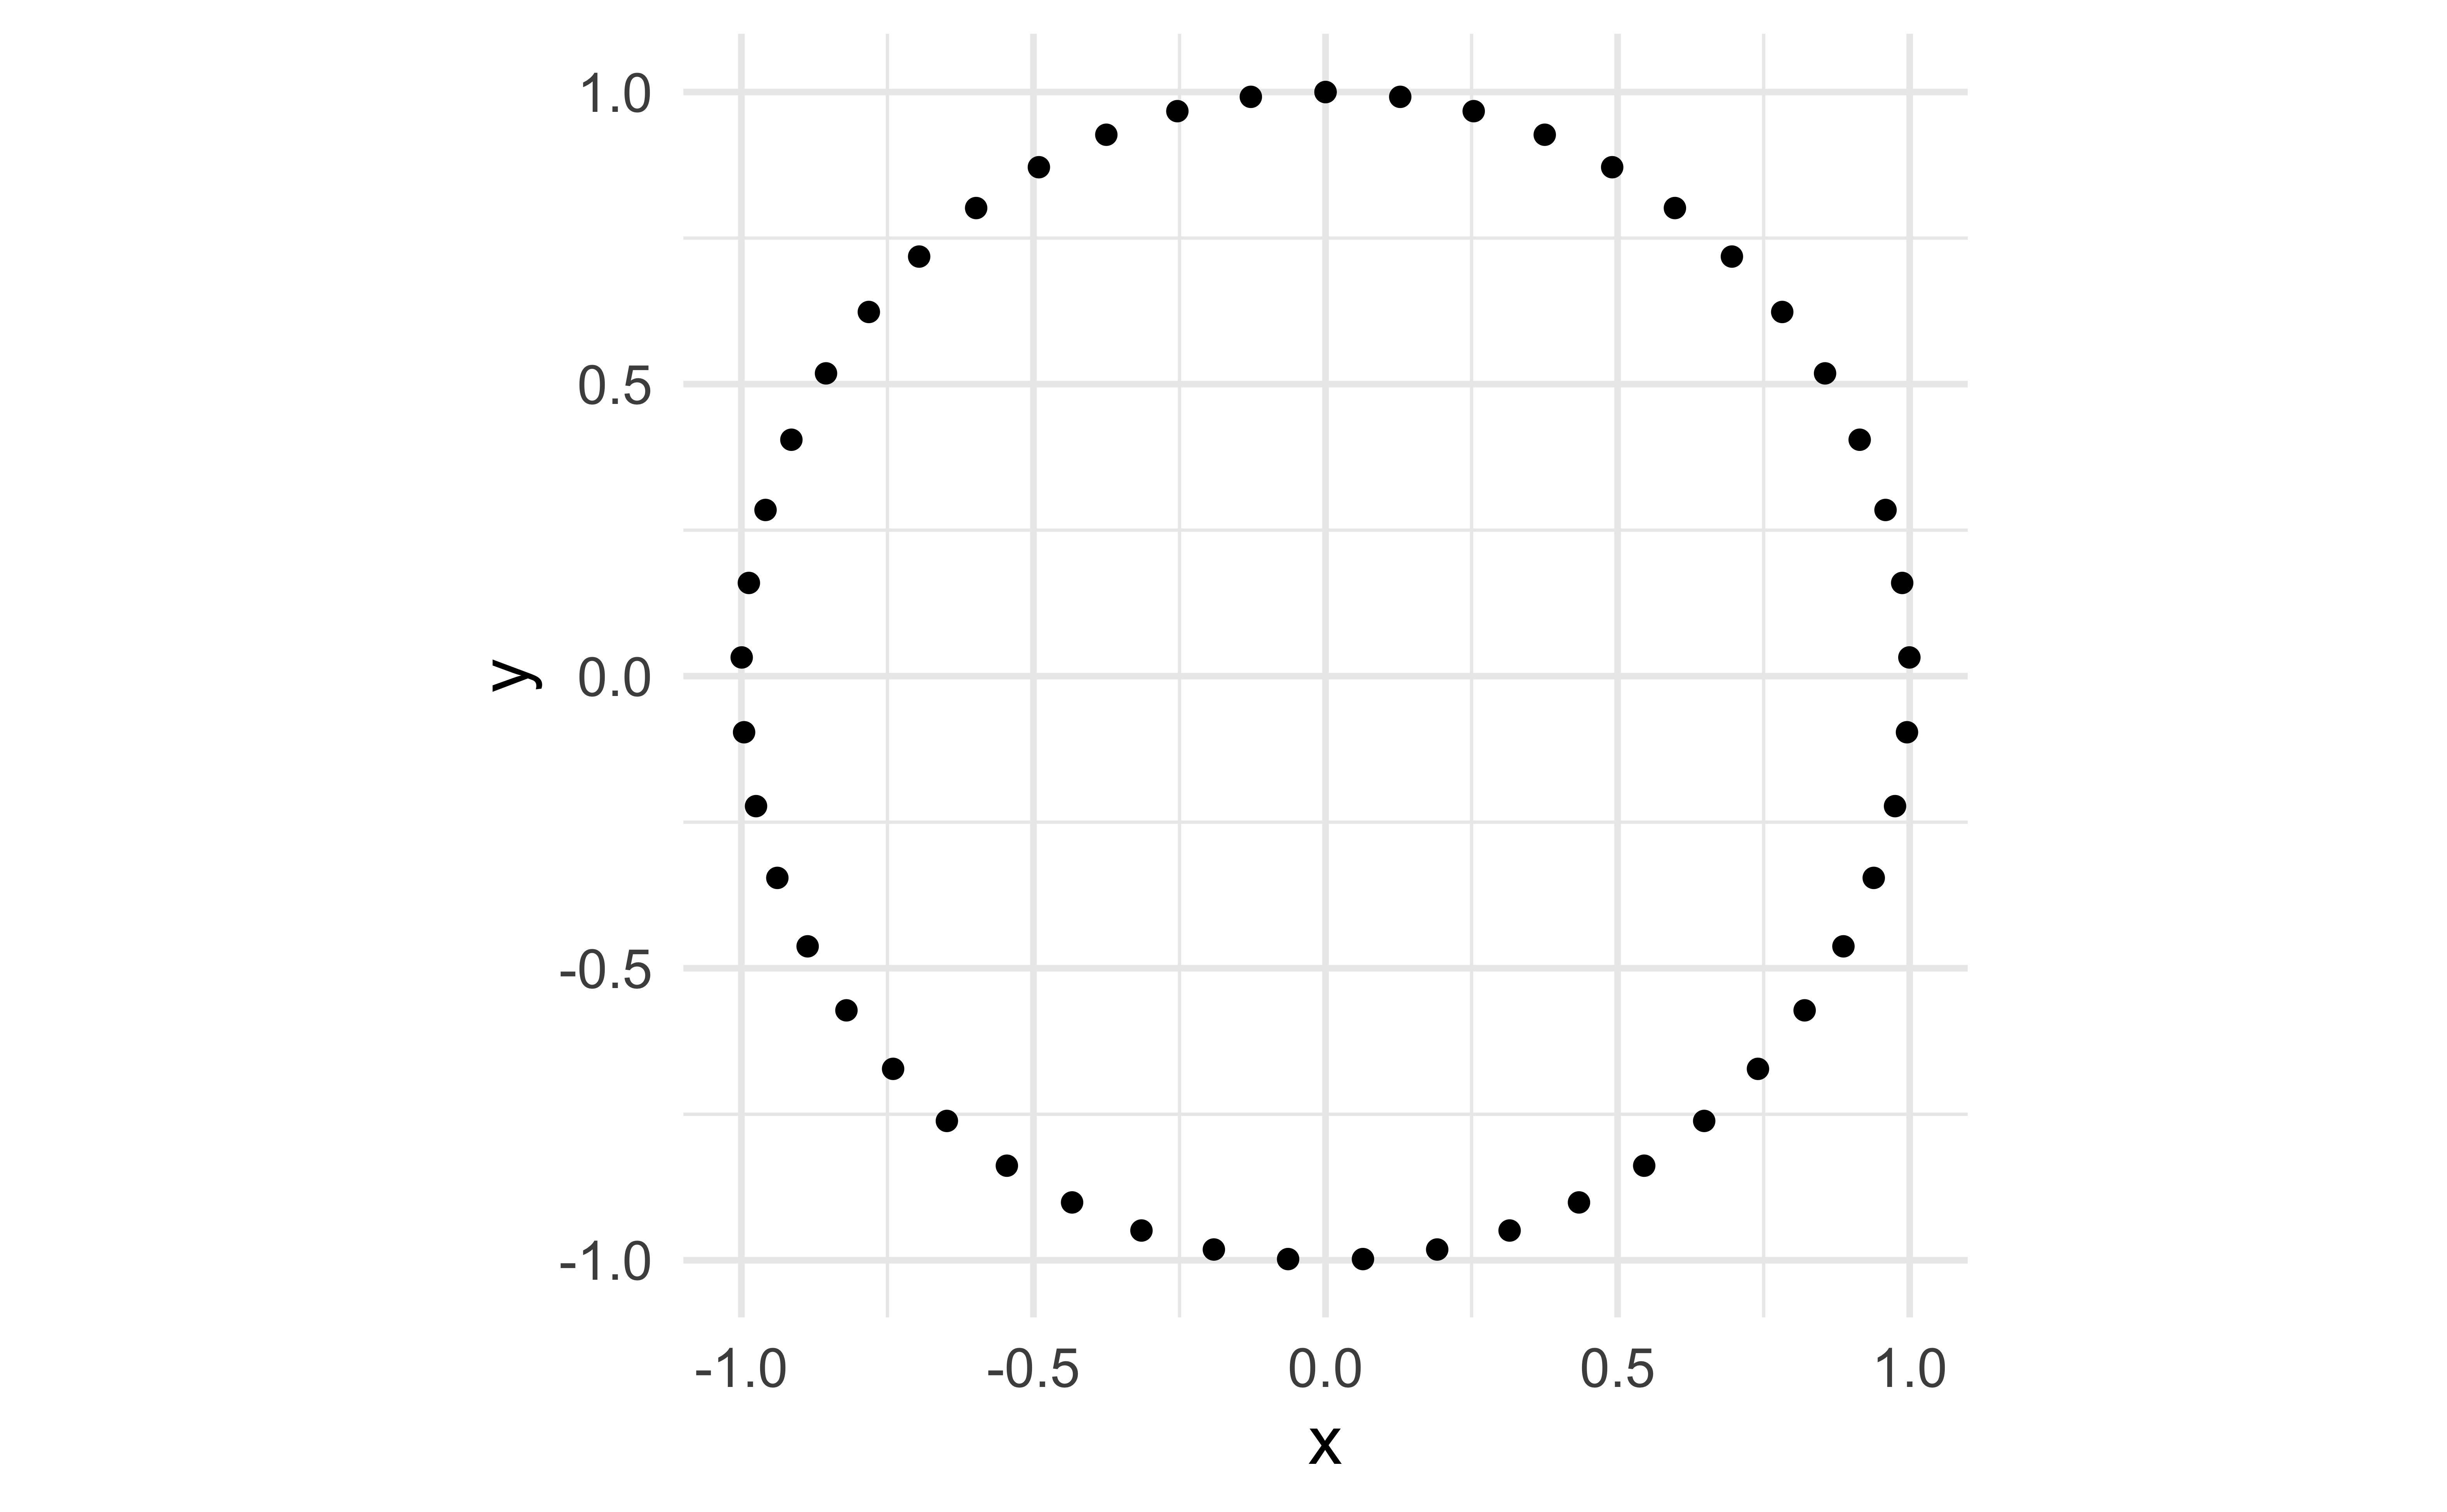
Let’s make a circle
The Golden Angle
The golden angle is the angle subtended by the smaller (red) arc when two arcs that make up a circle are in the golden ratio.
\[ \pi(3 − \sqrt{5}) \]
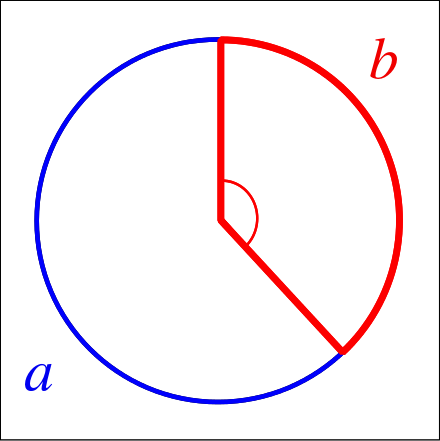
The golden angle is the angle separating successive florets on a sunflower.
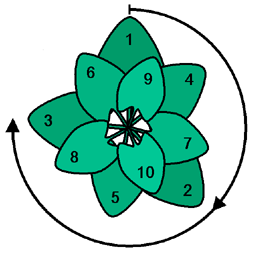
Petals with the golden angle
# set golden angle
angle <- pi * (3 - sqrt(5))

# set number of points
points <- 50

# make data frame
df <- tibble(
  i = 1:points,
  t = (1:points) * angle,
  x = sin(t),
  y = cos(t)
)

# plot points in a spiral
ggplot(df, aes(x = x * t, y = y * t)) +
  geom_path(color = "gray") +
  geom_text(aes(label = i)) +
  coord_equal()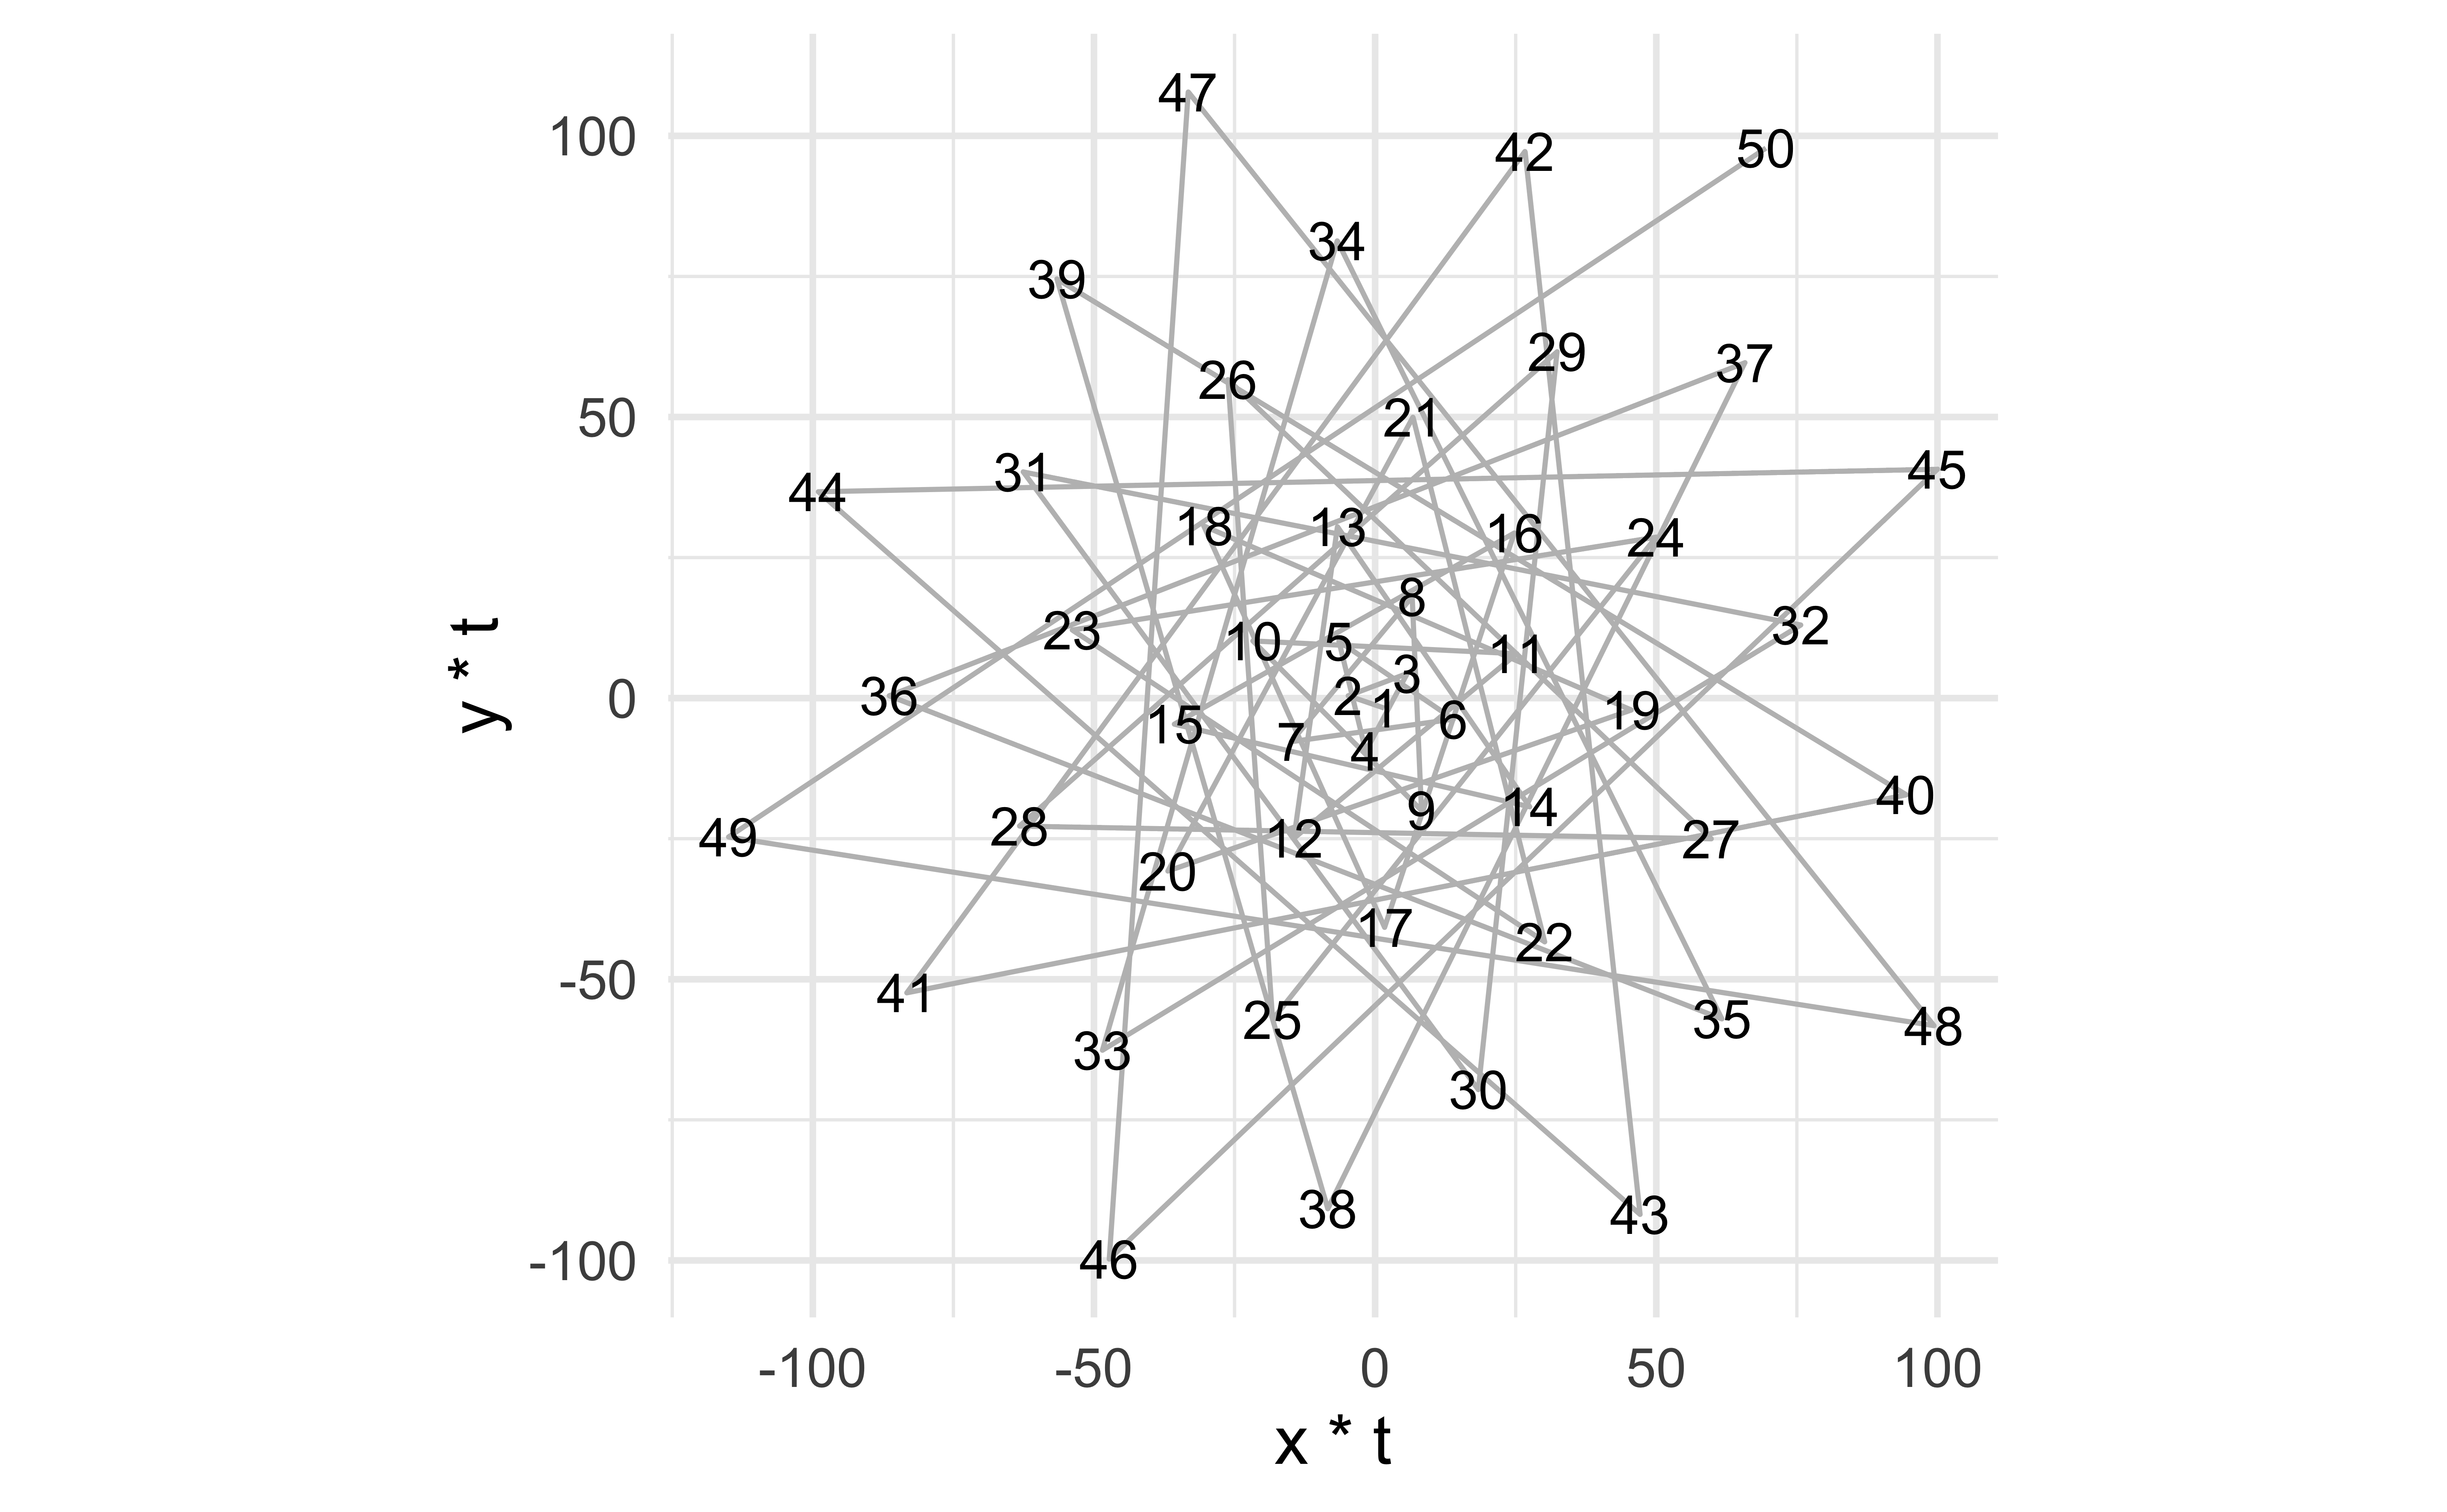
Paths to points
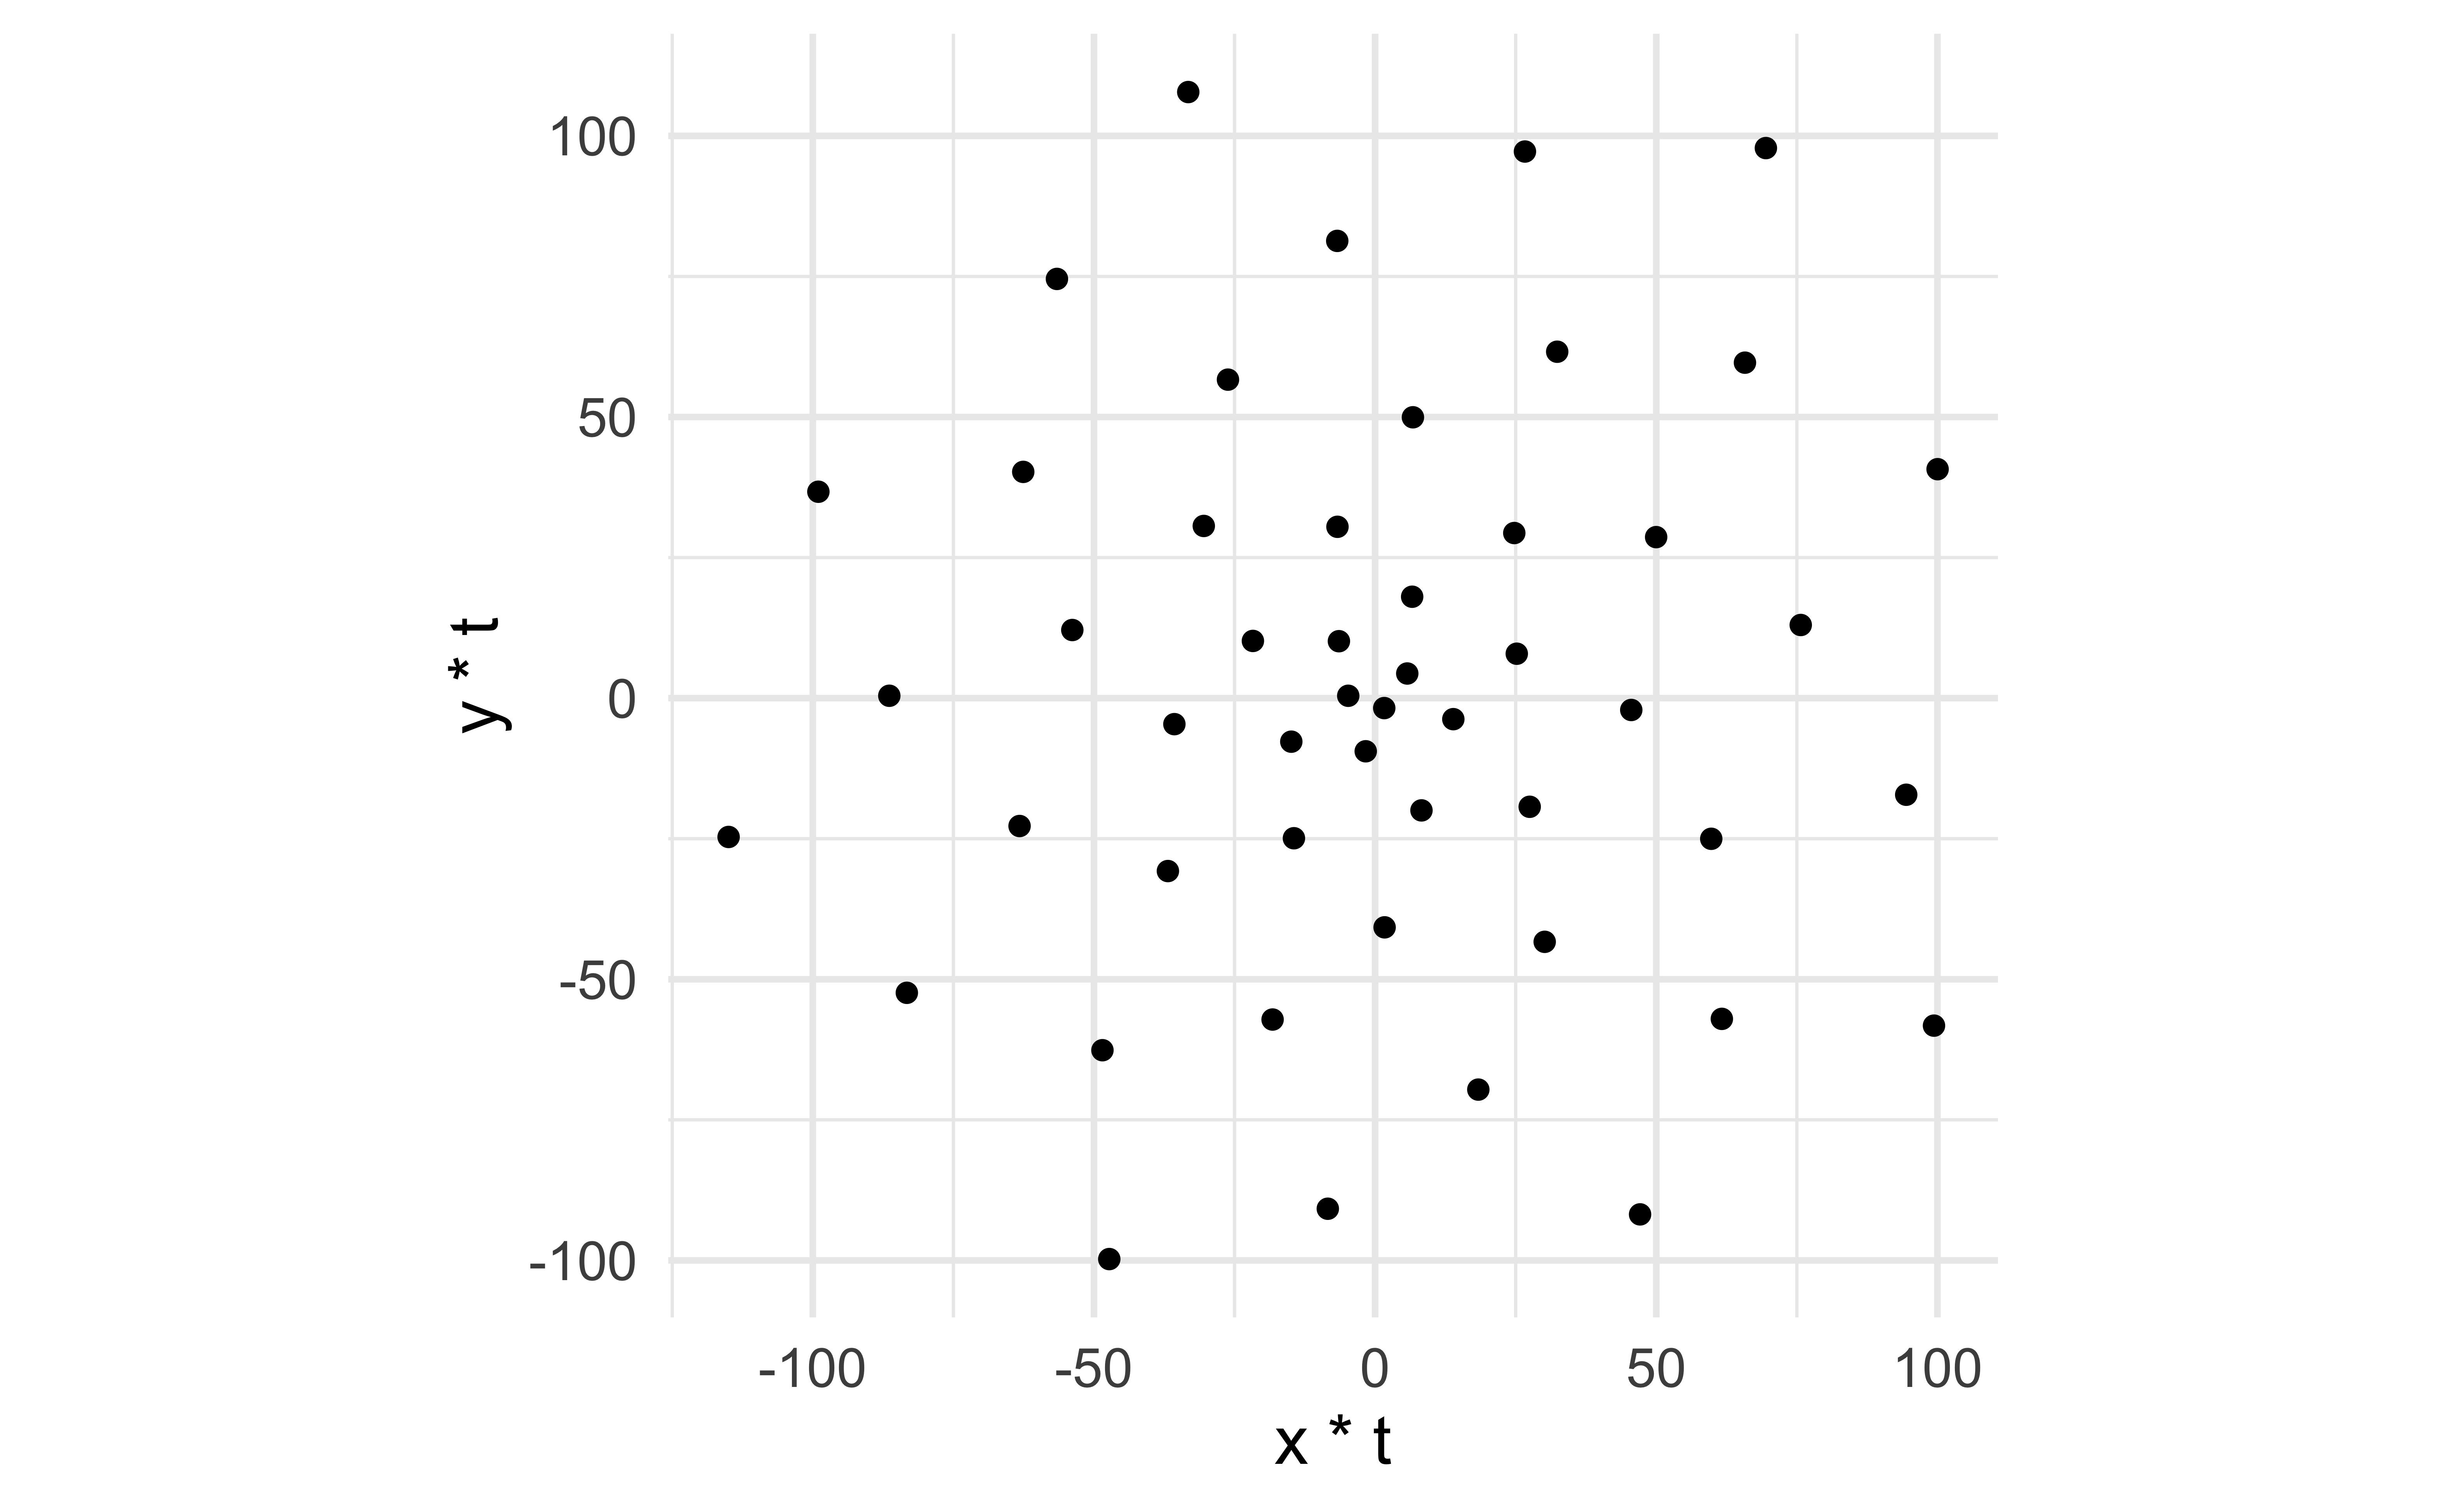
Without the background
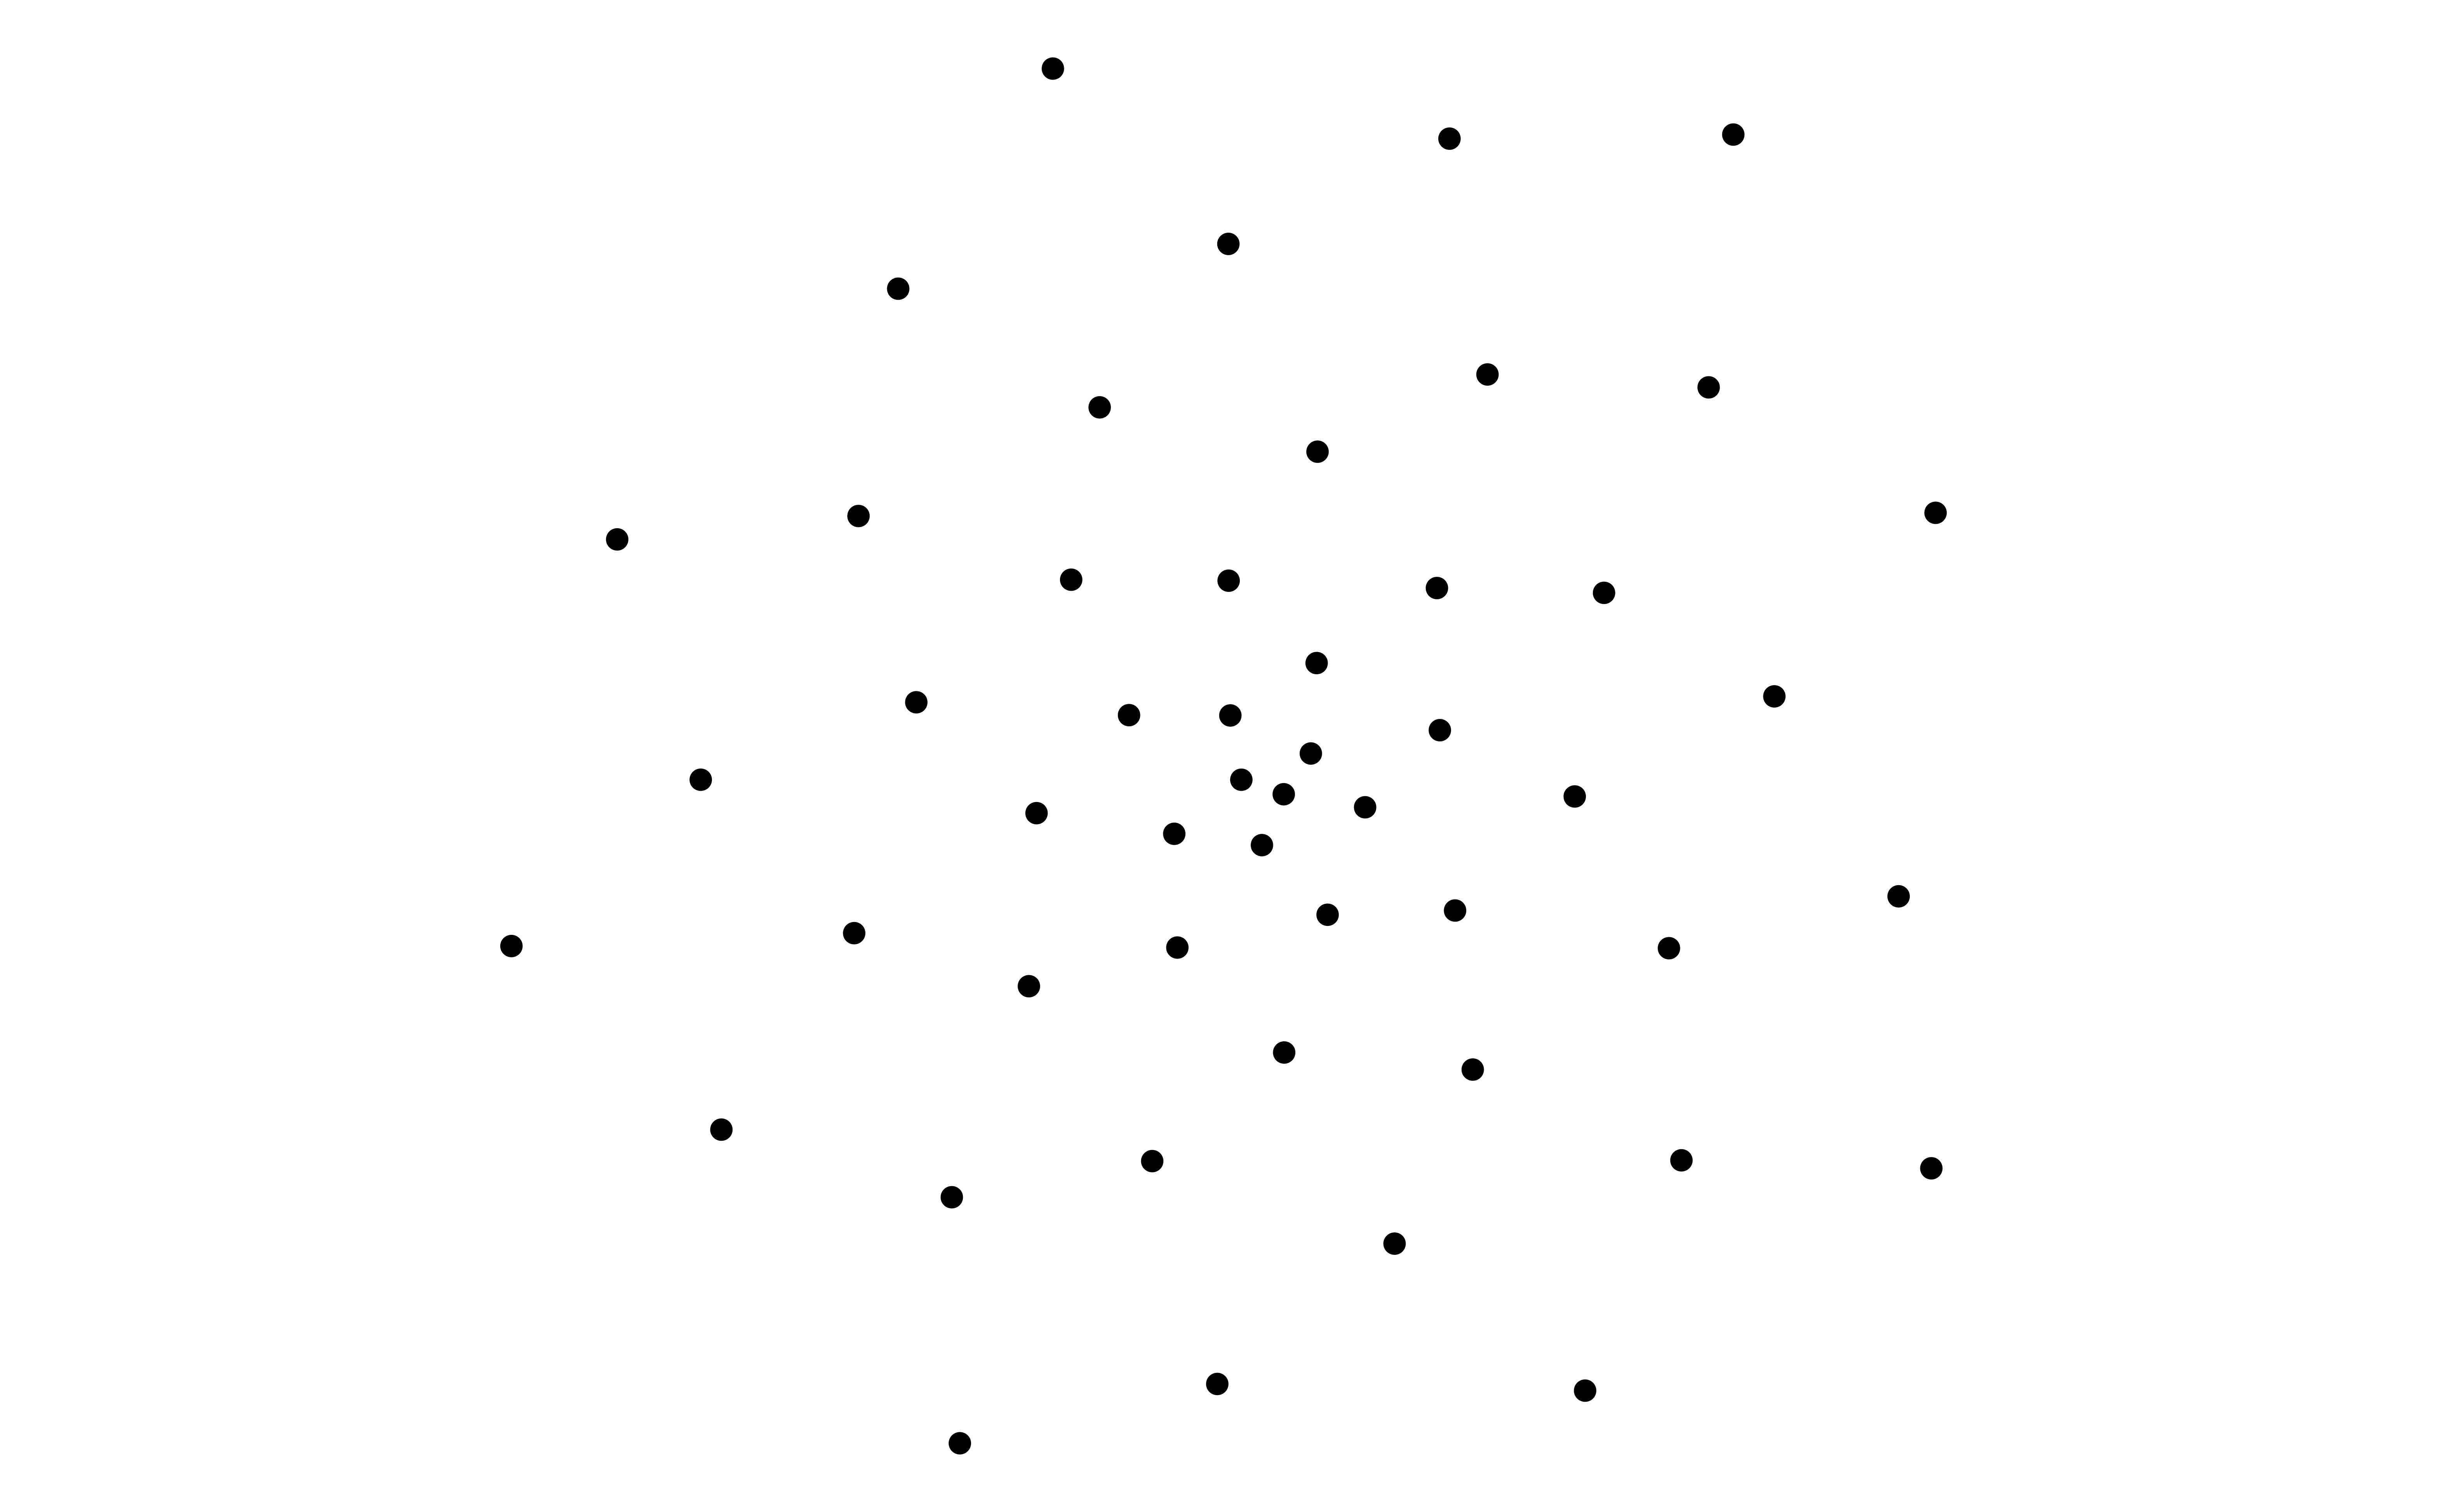
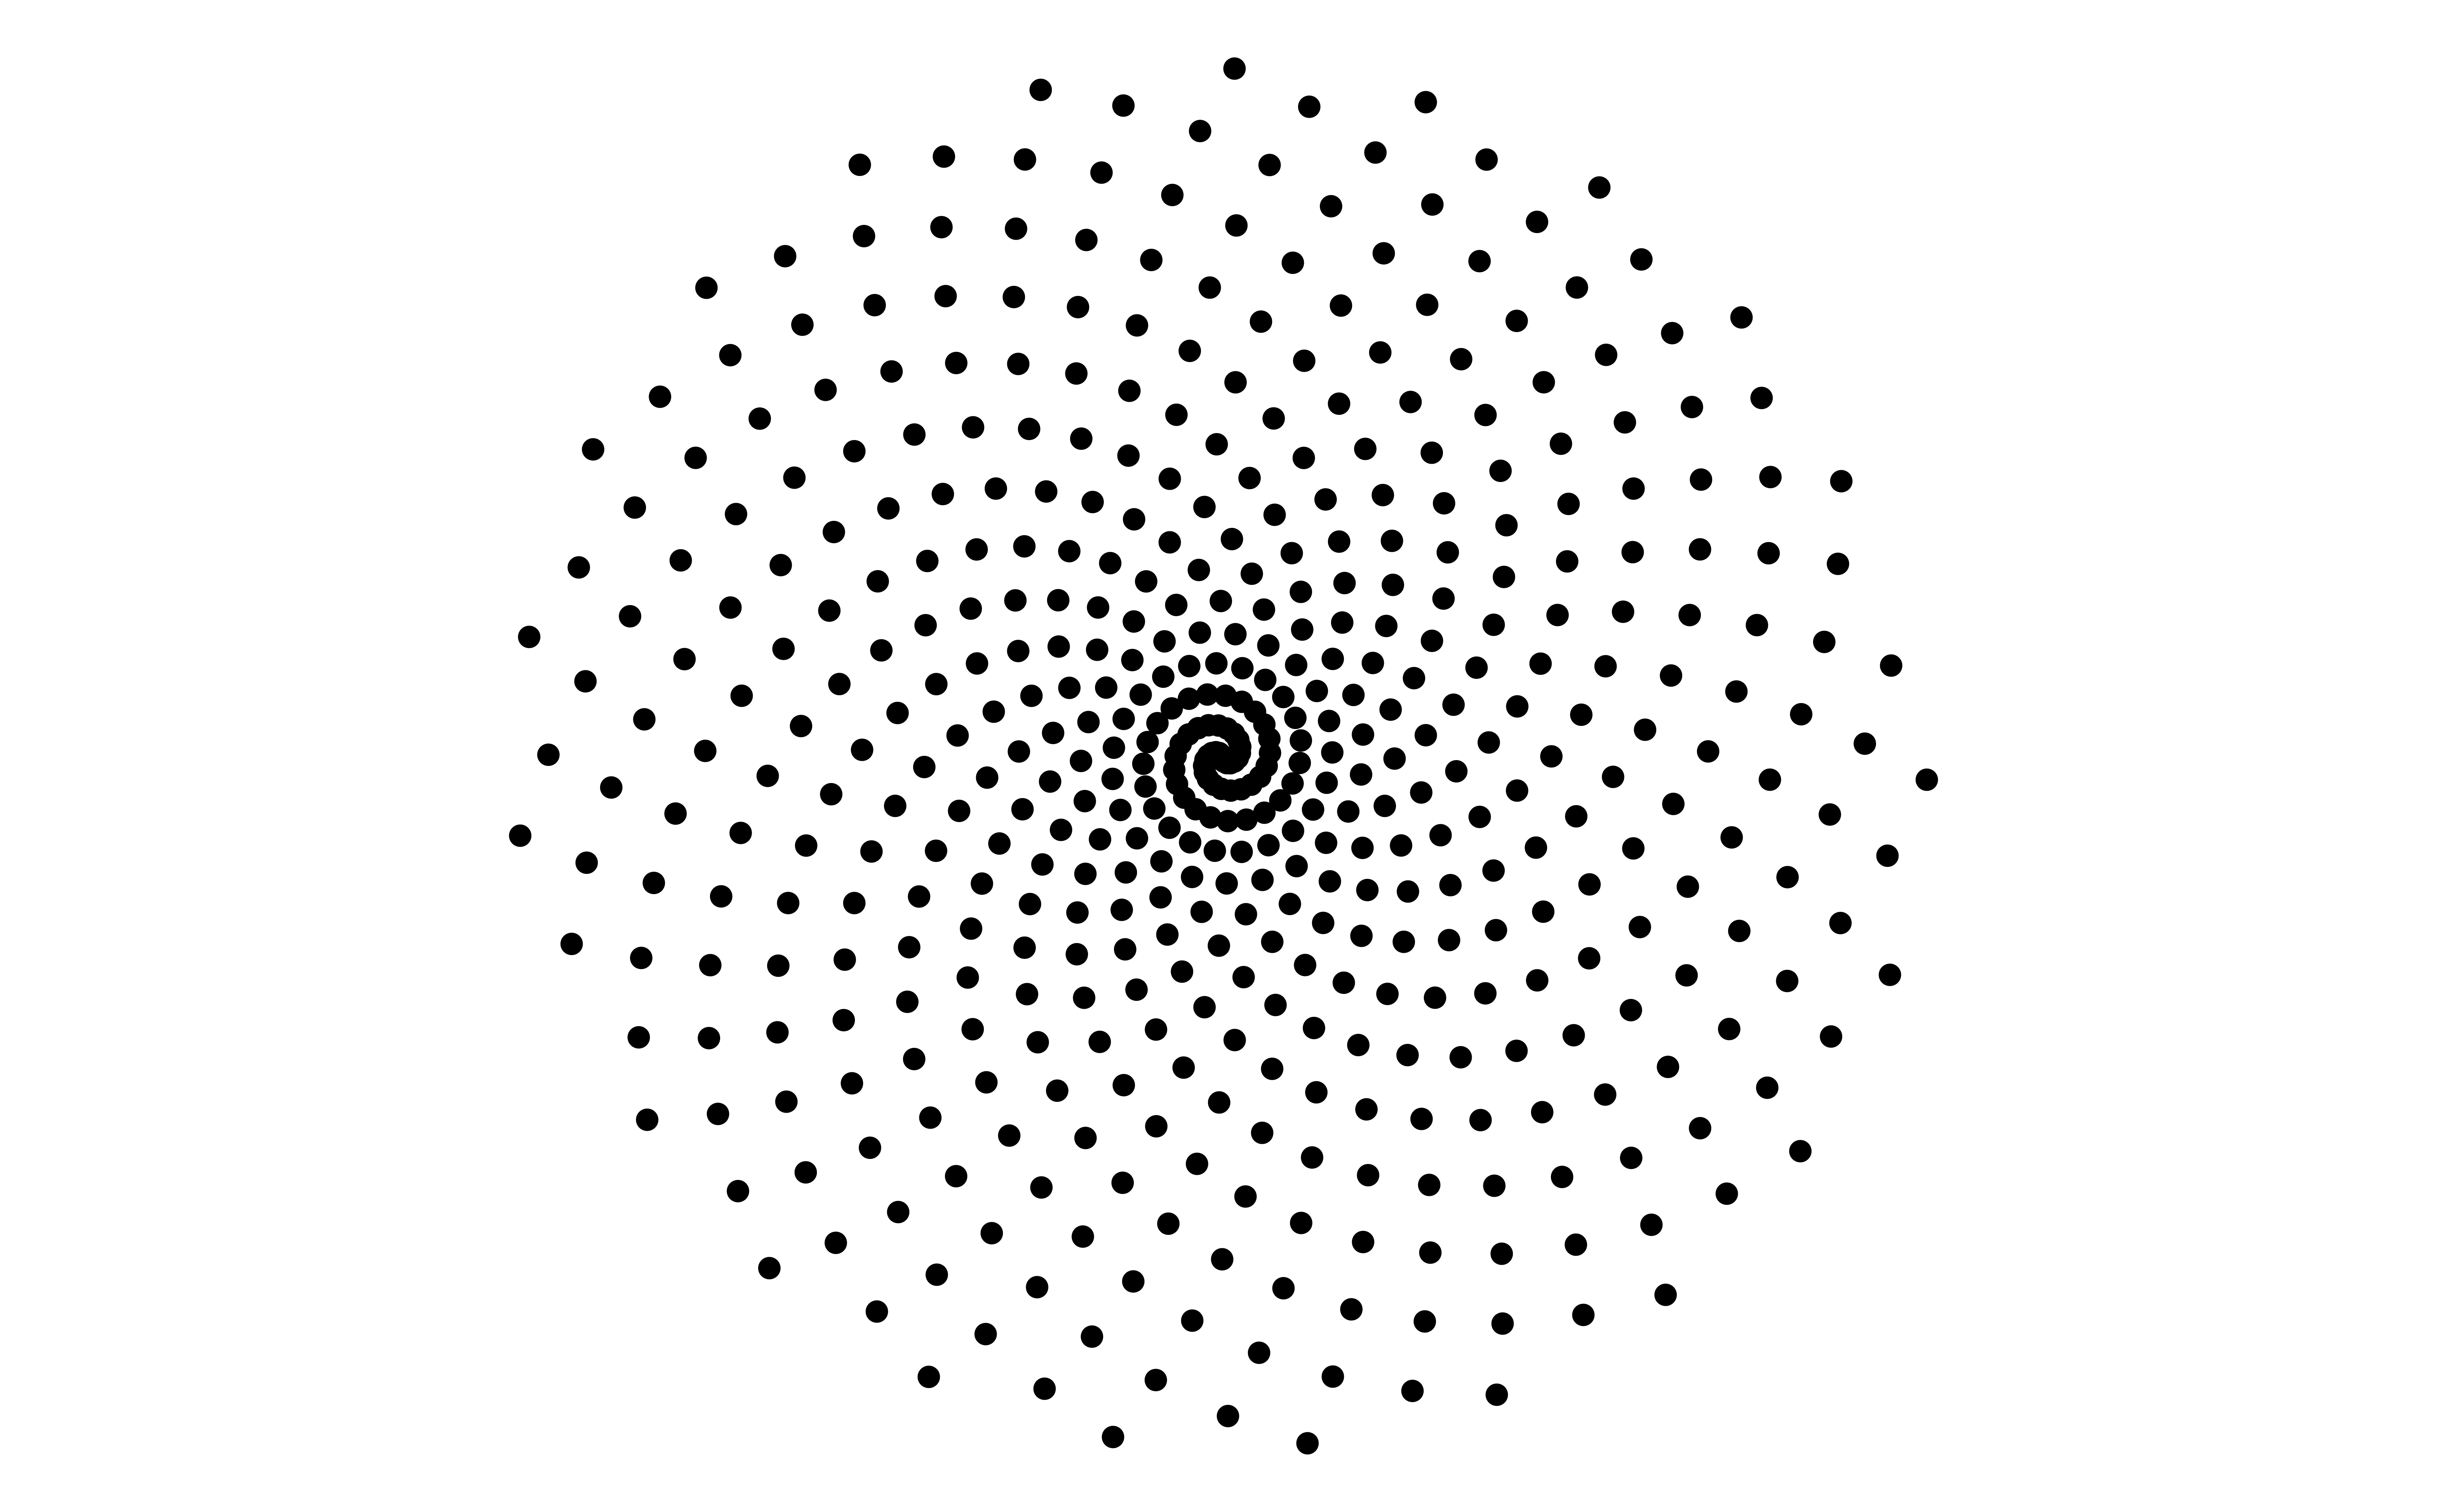
More points
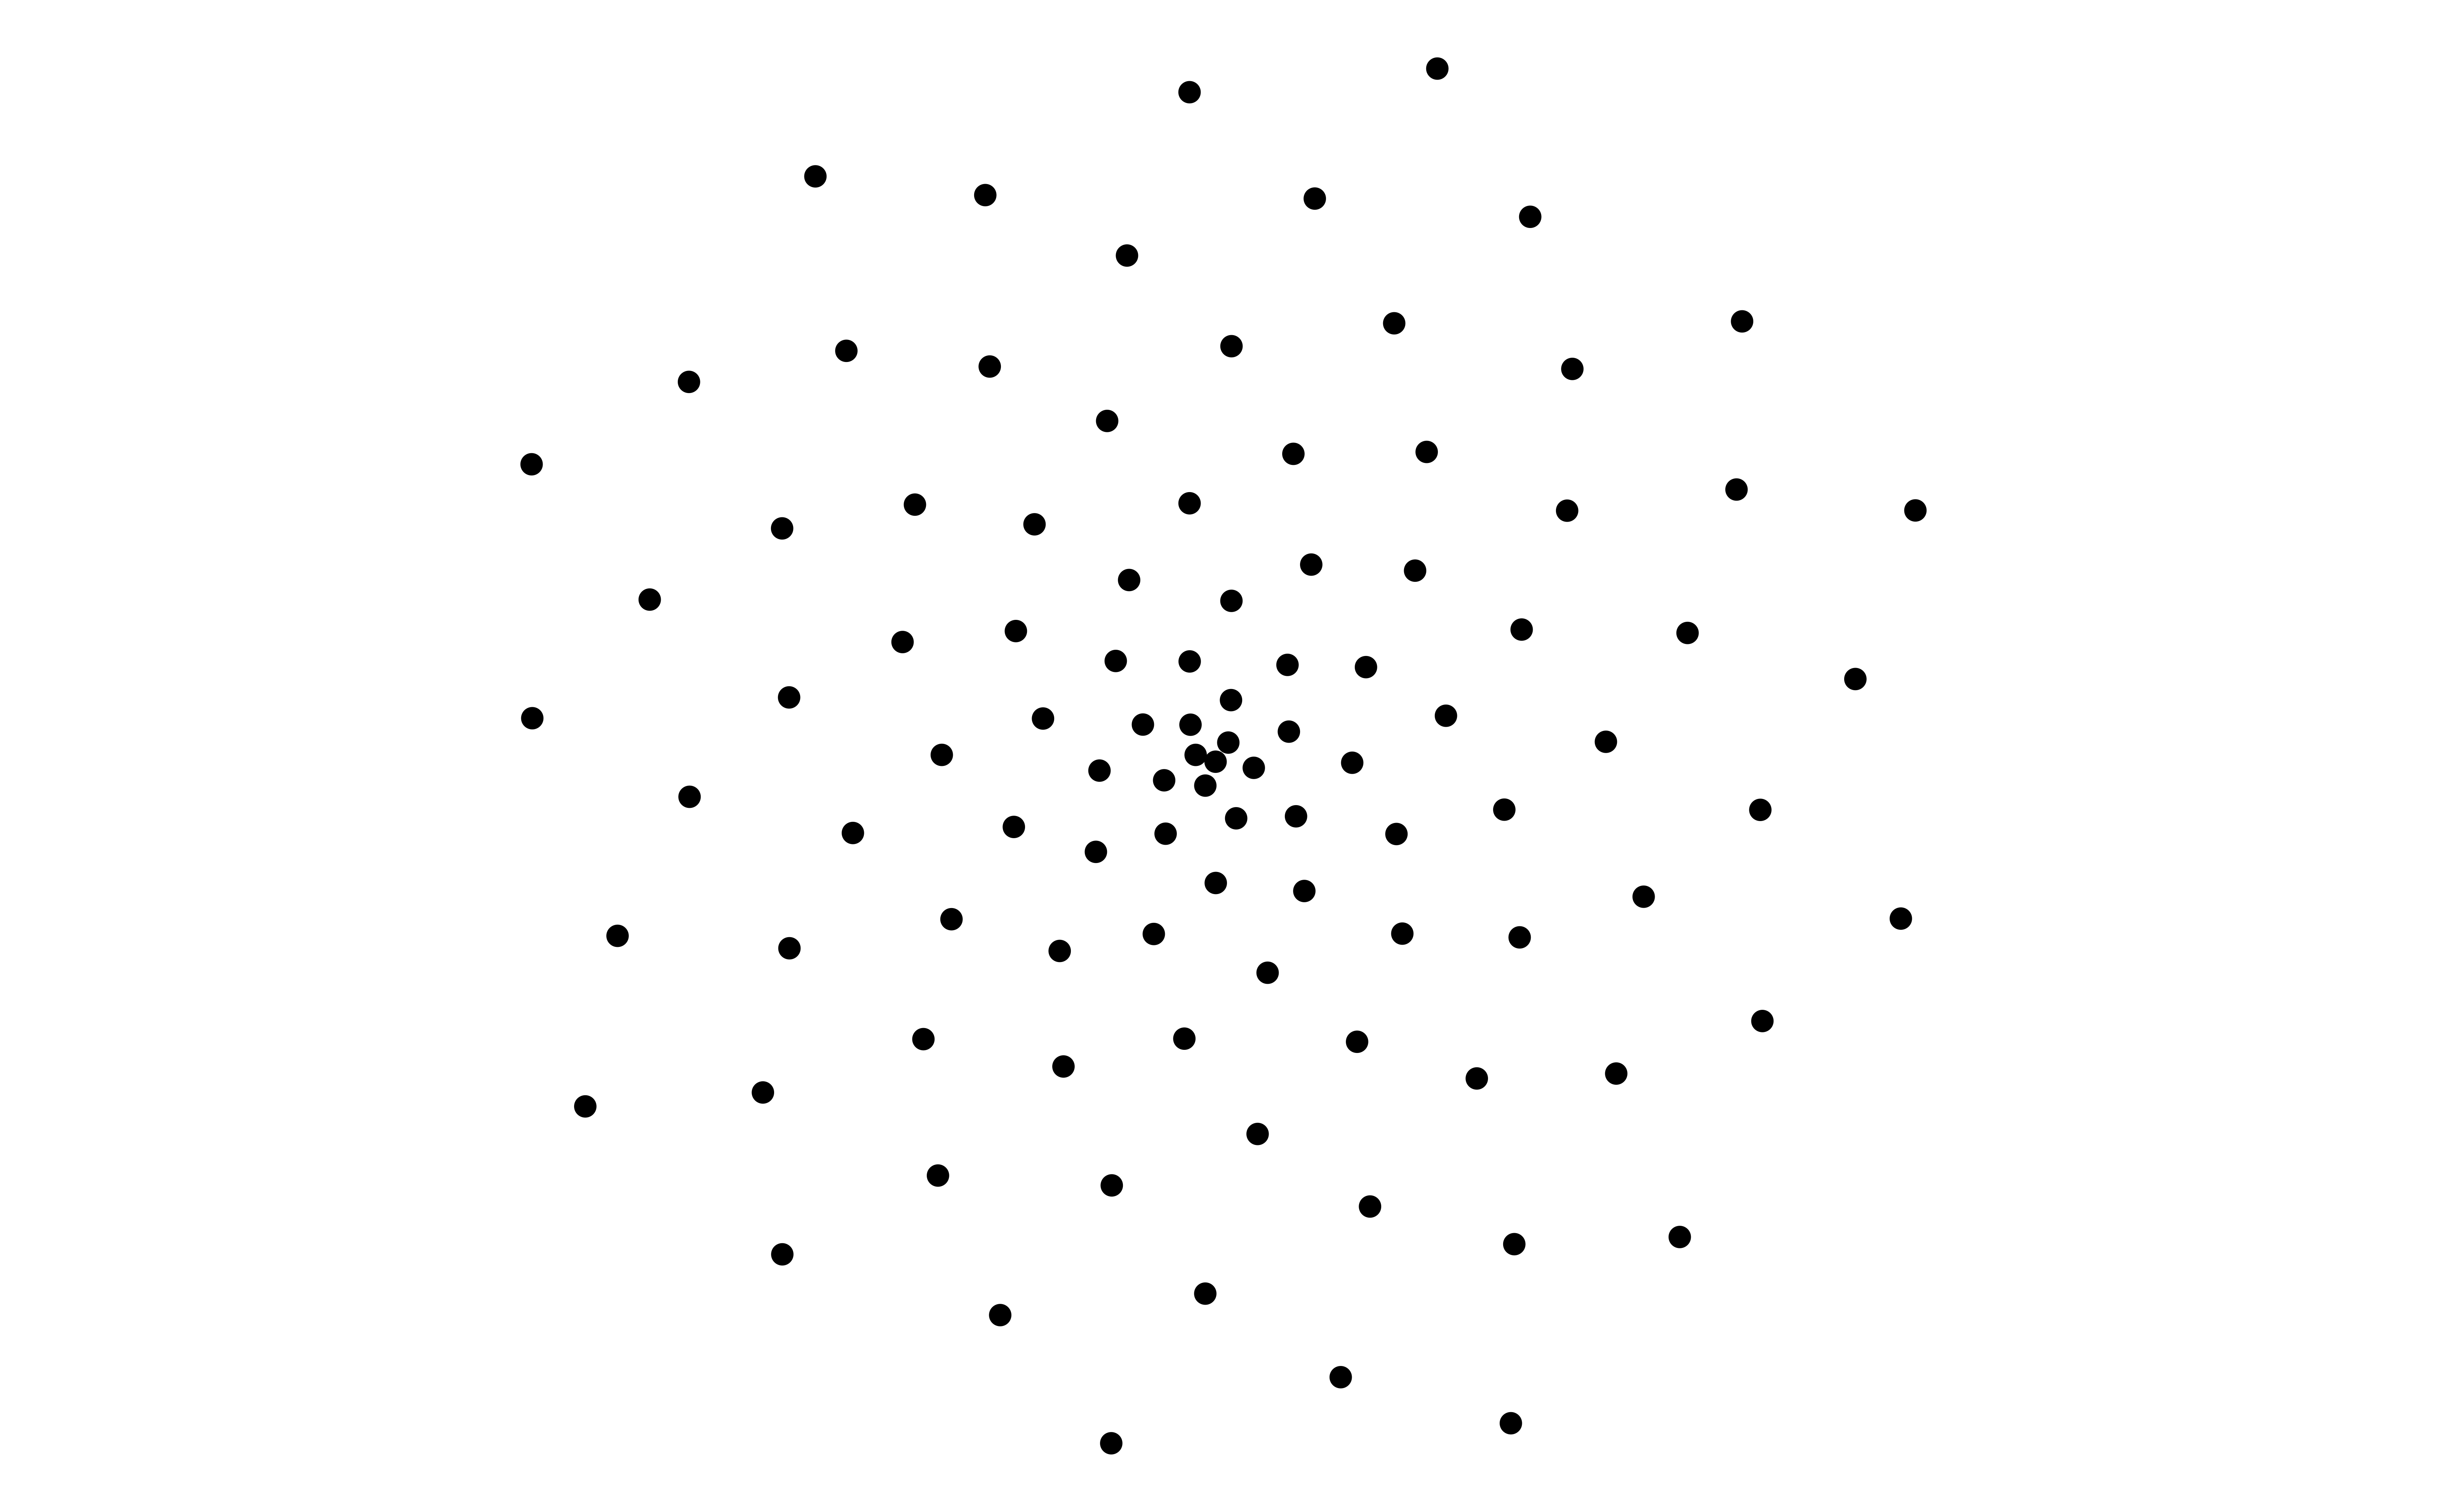
Adjust points
Use the function

Change parameters
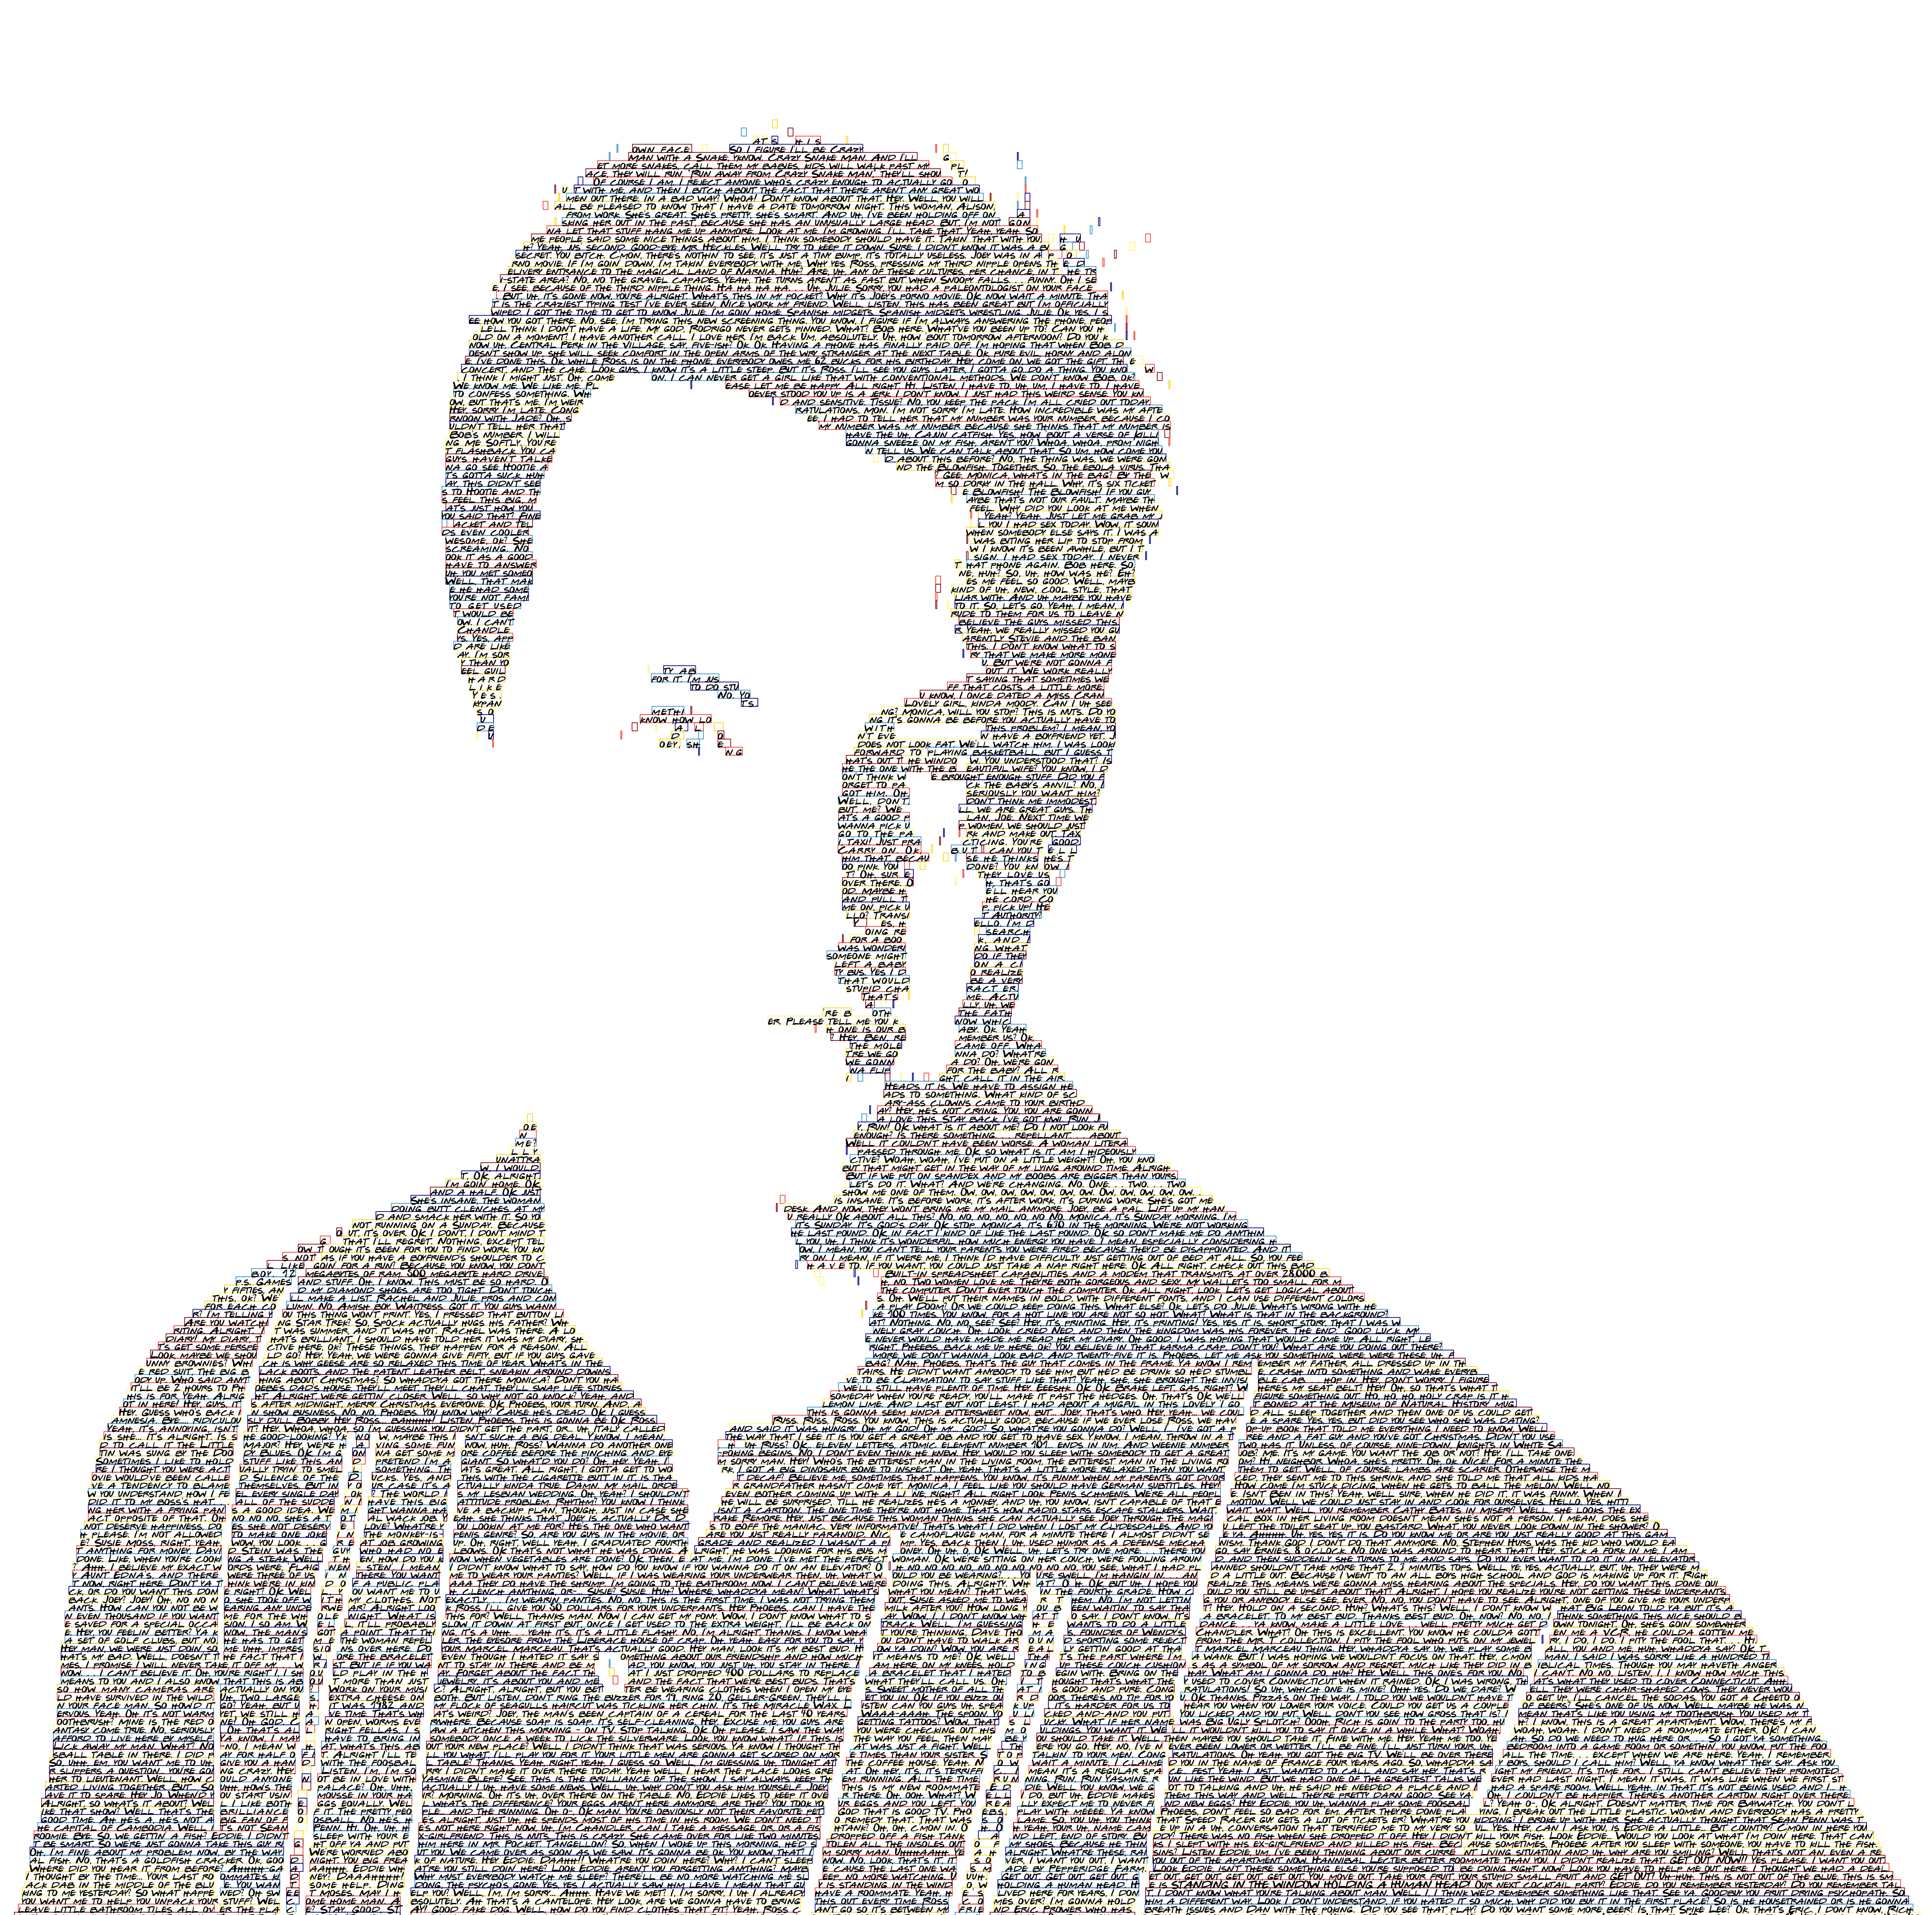
Writing over images
Learn/do more
-
R packages:
More aRtists: rtistry art gallery by Ijeamaka Anyene
A whole course on Generative Art by Danielle Navarro: https://art-from-code.netlify.app
![]()